|
Download Data (XLS File) |
|
||||||||
|
||||||||
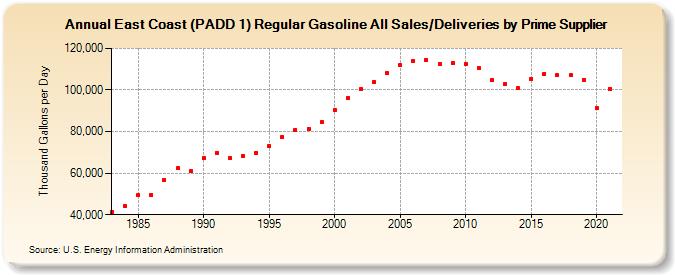
| East Coast (PADD 1) Regular Gasoline All Sales/Deliveries by Prime Supplier (Thousand Gallons per Day) | ||||||||
| Decade | Year-0 | Year-1 | Year-2 | Year-3 | Year-4 | Year-5 | Year-6 | Year-7 | Year-8 | Year-9 |
|---|---|---|---|---|---|---|---|---|---|---|
| 1980's | 41,281.1 | 44,054.8 | 49,324.3 | 49,601.3 | 56,649.6 | 62,238.8 | 60,999.3 | |||
| 1990's | 67,252.2 | 69,898.6 | 67,214.2 | 68,423.6 | 69,817.5 | 73,140.1 | 77,355.5 | 80,816.1 | 81,446.3 | 84,614.1 |
| 2000's | 90,538.0 | 96,042.5 | 100,454.3 | 103,987.7 | 107,941.8 | 111,883.4 | 114,014.4 | 114,642.6 | 112,430.0 | 112,886.8 |
| 2010's | 112,683.9 | 110,327.5 | 104,753.8 | 102,665.2 | 100,765.5 | 105,396.8 | 107,888.1 | 107,113.5 | 107,166.7 | 104,925.0 |
| 2020's | 91,426.7 |
| - = No Data Reported; -- = Not Applicable; NA = Not Available; W = Withheld to avoid disclosure of individual company data. |
| Release Date: 6/1/2022 |
| Next Release Date: TBD |