|
Download Data (XLS File) |
|
||||||||
|
||||||||
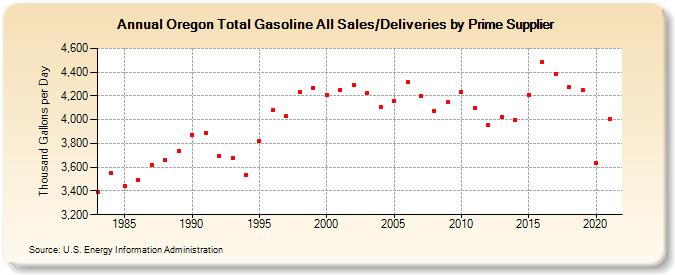
| Oregon Total Gasoline All Sales/Deliveries by Prime Supplier (Thousand Gallons per Day) | ||||||||
| Decade | Year-0 | Year-1 | Year-2 | Year-3 | Year-4 | Year-5 | Year-6 | Year-7 | Year-8 | Year-9 |
|---|---|---|---|---|---|---|---|---|---|---|
| 1980's | 3,393.1 | 3,550.0 | 3,445.3 | 3,495.4 | 3,620.6 | 3,658.0 | 3,740.0 | |||
| 1990's | 3,874.2 | 3,889.0 | 3,693.3 | 3,677.4 | 3,537.0 | 3,821.1 | 4,079.4 | 4,028.6 | 4,235.2 | 4,269.5 |
| 2000's | 4,207.2 | 4,252.8 | 4,295.8 | 4,224.2 | 4,109.1 | 4,156.5 | 4,314.4 | 4,199.1 | 4,075.3 | 4,145.2 |
| 2010's | 4,237.1 | 4,098.6 | 3,955.8 | 4,023.0 | 3,993.8 | 4,208.4 | 4,488.7 | 4,383.4 | 4,274.7 | 4,247.7 |
| 2020's | 3,632.8 |
| - = No Data Reported; -- = Not Applicable; NA = Not Available; W = Withheld to avoid disclosure of individual company data. |
| Release Date: 6/1/2022 |
| Next Release Date: TBD |