|
Download Data (XLS File) |
|
||||||||
|
||||||||
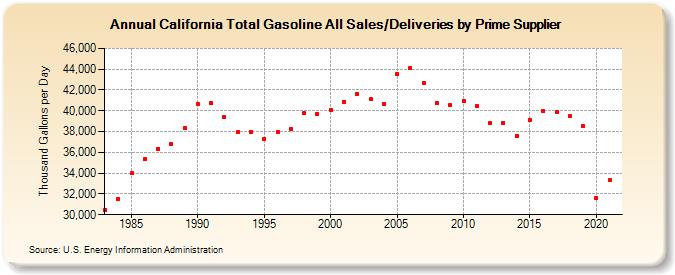
| California Total Gasoline All Sales/Deliveries by Prime Supplier (Thousand Gallons per Day) | ||||||||
| Decade | Year-0 | Year-1 | Year-2 | Year-3 | Year-4 | Year-5 | Year-6 | Year-7 | Year-8 | Year-9 |
|---|---|---|---|---|---|---|---|---|---|---|
| 1980's | 30,432.0 | 31,543.1 | 33,980.9 | 35,348.6 | 36,365.1 | 36,826.8 | 38,354.4 | |||
| 1990's | 40,675.5 | 40,728.3 | 39,401.6 | 37,942.0 | 37,992.0 | 37,319.4 | 37,961.8 | 38,250.9 | 39,755.0 | 39,698.9 |
| 2000's | 40,102.5 | 40,871.3 | 41,648.2 | 41,130.9 | 40,645.3 | 43,560.3 | 44,084.5 | 42,716.0 | 40,767.3 | 40,521.1 |
| 2010's | 40,970.6 | 40,475.8 | 38,820.6 | 38,847.2 | 37,549.1 | 39,141.3 | 39,965.9 | 39,854.3 | 39,453.2 | 38,533.7 |
| 2020's | 31,644.1 |
| - = No Data Reported; -- = Not Applicable; NA = Not Available; W = Withheld to avoid disclosure of individual company data. |
| Release Date: 6/1/2022 |
| Next Release Date: TBD |