|
Download Data (XLS File) |
|
||||||||
|
||||||||
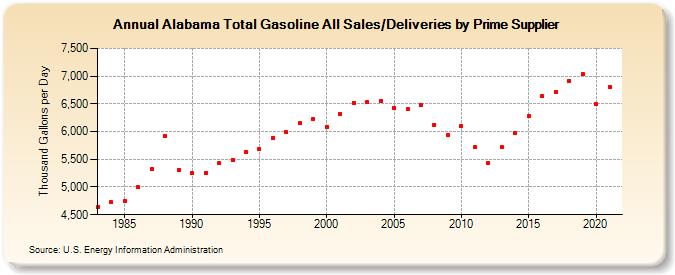
| Alabama Total Gasoline All Sales/Deliveries by Prime Supplier (Thousand Gallons per Day) | ||||||||
| Decade | Year-0 | Year-1 | Year-2 | Year-3 | Year-4 | Year-5 | Year-6 | Year-7 | Year-8 | Year-9 |
|---|---|---|---|---|---|---|---|---|---|---|
| 1980's | 4,645.3 | 4,722.7 | 4,741.2 | 4,996.4 | 5,319.4 | 5,922.9 | 5,307.2 | |||
| 1990's | 5,250.7 | 5,251.7 | 5,424.6 | 5,484.1 | 5,635.3 | 5,677.5 | 5,892.5 | 5,990.4 | 6,148.5 | 6,229.1 |
| 2000's | 6,082.4 | 6,312.4 | 6,523.3 | 6,524.2 | 6,552.4 | 6,431.3 | 6,408.7 | 6,475.7 | 6,126.6 | 5,937.2 |
| 2010's | 6,109.1 | 5,716.6 | 5,439.0 | 5,719.8 | 5,973.1 | 6,272.3 | 6,632.8 | 6,716.0 | 6,916.9 | 7,036.4 |
| 2020's | 6,495.9 |
| - = No Data Reported; -- = Not Applicable; NA = Not Available; W = Withheld to avoid disclosure of individual company data. |
| Release Date: 6/1/2022 |
| Next Release Date: TBD |