|
Download Data (XLS File) |
|
||||||||
|
||||||||
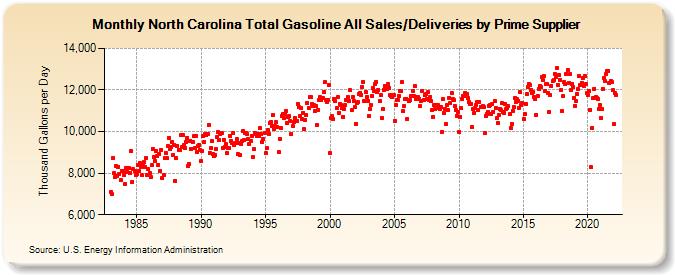
| North Carolina Total Gasoline All Sales/Deliveries by Prime Supplier (Thousand Gallons per Day) | ||||||||
| Year | Jan | Feb | Mar | Apr | May | Jun | Jul | Aug | Sep | Oct | Nov | Dec |
|---|---|---|---|---|---|---|---|---|---|---|---|---|
| 1983 | 7,104.6 | 6,982.6 | 8,738.6 | 8,017.6 | 7,790.4 | 8,349.7 | 7,848.3 | 8,316.5 | 7,978.2 | 7,648.0 | 8,102.7 | 8,088.5 |
| 1984 | 7,890.5 | 7,458.2 | 8,230.7 | 8,077.1 | 8,269.9 | 8,241.7 | 8,005.3 | 9,047.1 | 7,584.1 | 8,177.3 | 8,083.6 | 7,890.2 |
| 1985 | 7,963.9 | 8,389.5 | 8,093.1 | 8,495.2 | 8,312.9 | 7,892.2 | 8,428.1 | 8,528.2 | 8,300.4 | 8,734.0 | 7,903.5 | 8,193.6 |
| 1986 | 8,022.2 | 7,793.3 | 8,370.6 | 9,179.8 | 8,786.4 | 8,593.6 | 9,086.5 | 8,811.4 | 8,405.5 | 8,924.5 | 8,080.3 | 9,106.5 |
| 1987 | 7,742.3 | 7,902.7 | 8,709.9 | 8,975.3 | 8,736.0 | 9,289.4 | 9,703.6 | 9,165.6 | 9,260.1 | 9,493.3 | 8,870.1 | 9,361.4 |
| 1988 | 7,634.4 | 8,718.9 | 9,309.5 | 9,113.9 | 9,122.1 | 9,818.6 | 9,254.4 | 9,843.3 | 9,353.8 | 9,211.0 | 9,486.0 | 9,707.5 |
| 1989 | 8,351.1 | 8,429.5 | 9,558.1 | 9,173.4 | 9,478.7 | 9,771.1 | 9,203.4 | 9,809.1 | 9,015.5 | 9,300.5 | 9,370.4 | 9,107.4 |
| 1990 | 8,572.8 | 9,056.8 | 9,802.2 | 9,501.7 | 9,868.0 | 9,826.3 | 9,862.4 | 10,308.5 | 8,991.7 | 9,195.0 | 9,524.2 | 8,928.6 |
| 1991 | 8,818.5 | 8,855.9 | 9,139.4 | 9,740.8 | 9,977.7 | 9,574.4 | 9,863.4 | 9,919.4 | 9,231.5 | 9,612.6 | 9,261.2 | 9,412.7 |
| 1992 | 8,948.5 | 9,228.9 | 9,208.4 | 9,805.7 | 9,538.2 | 9,447.7 | 9,937.2 | 9,346.8 | 9,460.5 | 9,637.5 | 8,908.6 | 9,449.2 |
| 1993 | 8,854.3 | 9,384.9 | 9,523.7 | 10,022.5 | 9,616.8 | 9,920.1 | 9,940.5 | 9,882.2 | 9,622.8 | 9,400.6 | 9,539.3 | 9,792.7 |
| 1994 | 8,755.9 | 9,137.0 | 9,925.8 | 9,871.8 | 9,799.4 | 9,884.5 | 9,766.0 | 10,151.5 | 9,859.4 | 9,476.1 | 9,664.4 | 9,952.6 |
| 1995 | 8,950.0 | 9,215.2 | 10,057.2 | 9,904.9 | 10,387.6 | 10,470.3 | 10,263.9 | 10,816.5 | 10,110.8 | 10,253.2 | 10,445.3 | 10,234.6 |
| 1996 | 9,007.0 | 9,656.7 | 10,177.7 | 10,768.0 | 10,856.1 | 10,636.8 | 10,842.0 | 10,983.3 | 10,415.5 | 10,699.7 | 10,734.9 | 10,516.5 |
| 1997 | 9,869.8 | 10,278.3 | 10,461.5 | 10,672.5 | 10,497.6 | 10,502.8 | 11,343.6 | 11,179.6 | 10,730.6 | 11,114.0 | 10,591.1 | 10,893.6 |
| 1998 | 10,101.5 | 10,570.5 | 10,785.9 | 11,394.3 | 11,110.9 | 11,638.8 | 11,656.4 | 11,335.0 | 11,233.7 | 11,262.7 | 10,988.6 | 11,243.4 |
| 1999 | 10,322.6 | 11,059.6 | 11,537.9 | 11,639.6 | 11,520.6 | 11,609.9 | 11,906.3 | 12,368.5 | 11,504.6 | 11,419.7 | 11,517.6 | 12,242.7 |
| 2000 | 8,962.3 | 10,665.7 | 10,746.7 | 10,585.5 | 11,589.7 | 11,463.6 | 11,125.6 | 11,652.8 | 10,905.8 | 11,345.5 | 11,259.1 | 11,153.1 |
| 2001 | 10,723.7 | 11,073.0 | 11,288.4 | 11,511.7 | 11,509.5 | 11,652.5 | 11,467.5 | 11,985.0 | 11,015.9 | 11,671.6 | 11,472.7 | 11,160.6 |
| 2002 | 10,383.2 | 11,351.0 | 11,397.8 | 11,815.4 | 11,878.1 | 11,776.4 | 12,161.8 | 12,373.0 | 11,463.6 | 11,884.7 | 11,683.7 | 11,492.2 |
| 2003 | 10,746.0 | 11,063.7 | 11,284.2 | 11,715.7 | 12,075.9 | 11,961.4 | 12,285.4 | 12,384.4 | 11,885.7 | 12,016.2 | 11,455.9 | 11,745.7 |
| 2004 | 10,668.6 | 11,061.1 | 12,018.0 | 12,201.6 | 12,091.3 | 12,036.3 | 12,274.3 | 12,106.1 | 11,781.5 | 11,718.1 | 11,664.9 | 11,779.6 |
| 2005 | 10,521.8 | 11,291.0 | 11,512.3 | 11,529.0 | 11,729.7 | 11,953.9 | 11,968.4 | 12,392.4 | 10,965.7 | 11,237.0 | 11,557.1 | 11,582.7 |
| 2006 | 10,608.9 | 11,456.9 | 11,532.8 | 11,690.9 | 11,705.3 | 11,971.8 | 11,699.9 | 12,180.3 | 11,559.5 | 11,681.3 | 11,643.2 | 11,582.2 |
| 2007 | 11,207.6 | 11,484.0 | 11,971.4 | 11,496.7 | 11,746.1 | 11,798.8 | 11,569.9 | 11,881.2 | 11,526.4 | 11,681.8 | 11,466.6 | 11,025.5 |
| 2008 | 10,703.5 | 11,270.9 | 11,062.6 | 11,253.3 | 11,257.0 | 11,147.4 | 11,080.0 | 11,178.4 | 9,985.5 | 11,571.7 | 10,893.7 | 11,080.6 |
| 2009 | 10,342.5 | 11,296.3 | 11,024.8 | 11,623.0 | 11,366.9 | 11,861.1 | 11,567.5 | 11,503.2 | 11,236.0 | 11,014.5 | 10,754.7 | 10,947.4 |
| 2010 | 9,982.5 | 10,718.4 | 11,125.0 | 11,561.2 | 11,719.8 | 11,720.3 | 11,858.9 | 11,813.8 | 11,615.8 | 11,420.2 | 11,337.1 | 11,317.4 |
| 2011 | 10,215.5 | 11,069.1 | 10,883.8 | 11,142.4 | 11,266.1 | 11,411.1 | 11,021.5 | 11,427.5 | 11,195.7 | 11,197.0 | 11,207.4 | 11,180.8 |
| 2012 | 9,913.7 | 10,767.2 | 10,829.7 | 10,960.1 | 11,251.0 | 11,288.2 | 10,857.4 | 11,305.5 | 10,946.4 | 11,474.5 | 11,148.8 | 10,632.8 |
| 2013 | 10,420.4 | 10,813.1 | 11,100.5 | 11,018.6 | 11,359.6 | 10,953.6 | 10,912.9 | 11,301.4 | 11,089.4 | 11,147.5 | 11,215.2 | 10,821.9 |
| 2014 | 10,186.9 | 10,375.8 | 11,011.4 | 11,179.0 | 11,634.7 | 11,435.0 | 11,551.4 | 11,481.9 | 11,154.1 | 11,900.8 | 11,288.8 | 11,371.8 |
| 2015 | 10,608.7 | 10,820.5 | 11,339.7 | 11,808.3 | 12,129.0 | 12,284.0 | 12,246.1 | 12,011.0 | 11,844.4 | 11,887.4 | 11,666.8 | 11,553.4 |
| 2016 | 10,819.9 | 11,710.8 | 12,061.1 | 12,190.1 | 12,151.1 | 12,603.9 | 12,462.7 | 12,654.5 | 11,953.1 | 12,280.2 | 12,275.1 | 11,863.9 |
| 2017 | 10,955.7 | 11,746.9 | 12,206.7 | 12,409.7 | 12,456.2 | 12,780.4 | 12,630.1 | 13,057.6 | 12,233.0 | 12,697.2 | 12,492.1 | 11,998.3 |
| 2018 | 10,996.2 | 11,689.5 | 12,362.0 | 12,274.5 | 12,786.2 | 12,964.4 | 12,337.4 | 12,753.5 | 11,983.9 | 12,273.8 | 12,119.2 | 11,632.5 |
| 2019 | 11,240.2 | 11,457.1 | 11,826.8 | 12,038.2 | 12,653.2 | 12,242.9 | 12,356.7 | 12,580.0 | 12,193.5 | 12,661.4 | 12,285.3 | 11,862.0 |
| 2020 | 11,736.1 | 11,932.8 | 11,049.4 | 8,280.5 | 10,182.3 | 11,617.0 | 12,064.8 | 11,649.3 | 11,602.4 | 11,587.5 | 11,074.4 | 11,273.2 |
| 2021 | 10,657.8 | 11,074.6 | 12,038.2 | 12,584.0 | 12,418.8 | 12,782.3 | 12,915.4 | 12,927.7 | 12,322.7 | 12,435.2 | 12,389.2 | 11,979.1 |
| 2022 | 10,349.5 | 11,870.7 | 11,781.6 | |||||||||
| - = No Data Reported; -- = Not Applicable; NA = Not Available; W = Withheld to avoid disclosure of individual company data. |
| Release Date: 5/19/2022 |
| Next Release Date: TBD |