|
Download Data (XLS File) |
|
||||||||
|
||||||||
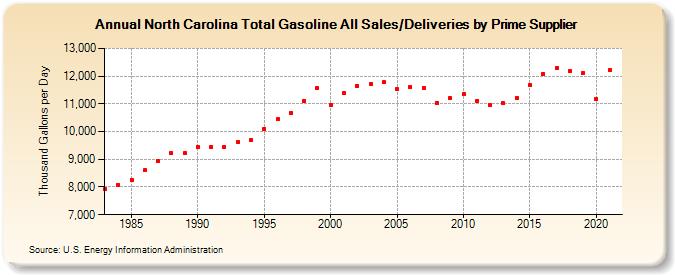
| North Carolina Total Gasoline All Sales/Deliveries by Prime Supplier (Thousand Gallons per Day) | ||||||||
| Decade | Year-0 | Year-1 | Year-2 | Year-3 | Year-4 | Year-5 | Year-6 | Year-7 | Year-8 | Year-9 |
|---|---|---|---|---|---|---|---|---|---|---|
| 1980's | 7,919.3 | 8,084.0 | 8,269.9 | 8,603.7 | 8,940.8 | 9,214.7 | 9,219.1 | |||
| 1990's | 9,456.4 | 9,455.5 | 9,436.6 | 9,625.4 | 9,690.1 | 10,098.1 | 10,443.3 | 10,681.8 | 11,112.3 | 11,558.1 |
| 2000's | 10,955.1 | 11,379.8 | 11,640.3 | 11,723.3 | 11,785.9 | 11,522.2 | 11,609.5 | 11,572.1 | 11,041.5 | 11,209.1 |
| 2010's | 11,352.1 | 11,100.2 | 10,947.4 | 11,013.9 | 11,220.7 | 11,688.0 | 12,085.7 | 12,308.0 | 12,183.5 | 12,121.1 |
| 2020's | 11,172.4 |
| - = No Data Reported; -- = Not Applicable; NA = Not Available; W = Withheld to avoid disclosure of individual company data. |
| Release Date: 6/1/2022 |
| Next Release Date: TBD |