|
Download Data (XLS File) |
|
||||||||
|
||||||||
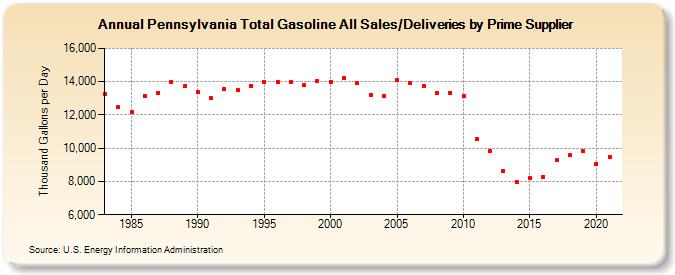
| Pennsylvania Total Gasoline All Sales/Deliveries by Prime Supplier (Thousand Gallons per Day) | ||||||||
| Decade | Year-0 | Year-1 | Year-2 | Year-3 | Year-4 | Year-5 | Year-6 | Year-7 | Year-8 | Year-9 |
|---|---|---|---|---|---|---|---|---|---|---|
| 1980's | 13,261.1 | 12,455.9 | 12,205.0 | 13,155.2 | 13,347.7 | 13,984.9 | 13,734.5 | |||
| 1990's | 13,349.9 | 12,996.7 | 13,570.7 | 13,511.2 | 13,754.6 | 13,988.2 | 13,986.0 | 13,977.2 | 13,778.0 | 14,017.3 |
| 2000's | 14,001.2 | 14,238.6 | 13,921.2 | 13,201.4 | 13,111.8 | 14,074.0 | 13,926.5 | 13,750.4 | 13,324.2 | 13,337.5 |
| 2010's | 13,135.3 | 10,555.5 | 9,830.7 | 8,617.2 | 7,979.8 | 8,207.6 | 8,286.3 | 9,271.1 | 9,571.4 | 9,813.2 |
| 2020's | 9,077.8 |
| - = No Data Reported; -- = Not Applicable; NA = Not Available; W = Withheld to avoid disclosure of individual company data. |
| Release Date: 6/1/2022 |
| Next Release Date: TBD |