|
Download Data (XLS File) |
|
||||||||
|
||||||||
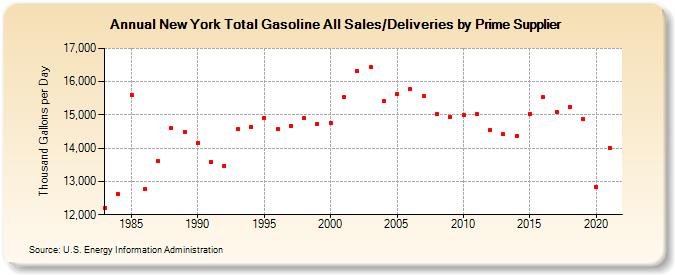
| New York Total Gasoline All Sales/Deliveries by Prime Supplier (Thousand Gallons per Day) | ||||||||
| Decade | Year-0 | Year-1 | Year-2 | Year-3 | Year-4 | Year-5 | Year-6 | Year-7 | Year-8 | Year-9 |
|---|---|---|---|---|---|---|---|---|---|---|
| 1980's | 12,209.8 | 12,619.3 | 15,610.5 | 12,769.6 | 13,617.8 | 14,604.1 | 14,492.1 | |||
| 1990's | 14,141.7 | 13,596.7 | 13,473.6 | 14,569.1 | 14,636.4 | 14,910.2 | 14,566.6 | 14,668.8 | 14,907.3 | 14,739.4 |
| 2000's | 14,758.9 | 15,531.6 | 16,319.7 | 16,437.1 | 15,413.7 | 15,616.8 | 15,770.2 | 15,559.2 | 15,016.6 | 14,949.4 |
| 2010's | 14,990.8 | 15,019.7 | 14,553.1 | 14,420.5 | 14,355.1 | 15,034.7 | 15,528.0 | 15,092.8 | 15,250.5 | 14,873.7 |
| 2020's | 12,843.4 |
| - = No Data Reported; -- = Not Applicable; NA = Not Available; W = Withheld to avoid disclosure of individual company data. |
| Release Date: 6/1/2022 |
| Next Release Date: TBD |