|
Download Data (XLS File) |
|
||||||||
|
||||||||
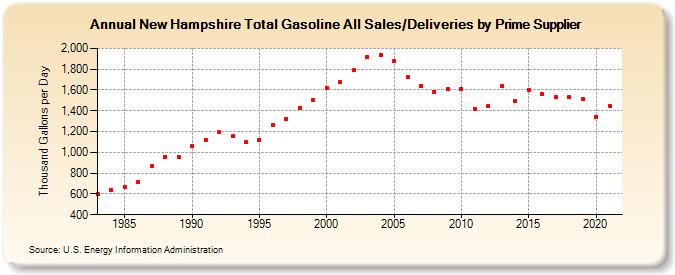
| New Hampshire Total Gasoline All Sales/Deliveries by Prime Supplier (Thousand Gallons per Day) | ||||||||
| Decade | Year-0 | Year-1 | Year-2 | Year-3 | Year-4 | Year-5 | Year-6 | Year-7 | Year-8 | Year-9 |
|---|---|---|---|---|---|---|---|---|---|---|
| 1980's | 598.1 | 637.6 | 662.6 | 718.4 | 864.2 | 958.3 | 958.7 | |||
| 1990's | 1,062.5 | 1,120.7 | 1,192.2 | 1,152.9 | 1,095.2 | 1,121.6 | 1,258.8 | 1,324.7 | 1,423.0 | 1,508.3 |
| 2000's | 1,620.2 | 1,674.1 | 1,789.6 | 1,920.3 | 1,932.9 | 1,880.4 | 1,726.4 | 1,640.1 | 1,585.1 | 1,613.9 |
| 2010's | 1,610.0 | 1,417.5 | 1,448.0 | 1,639.4 | 1,493.3 | 1,603.1 | 1,562.2 | 1,534.9 | 1,527.6 | 1,511.8 |
| 2020's | 1,341.5 |
| - = No Data Reported; -- = Not Applicable; NA = Not Available; W = Withheld to avoid disclosure of individual company data. |
| Release Date: 6/1/2022 |
| Next Release Date: TBD |