|
Download Data (XLS File) |
|
||||||||
|
||||||||
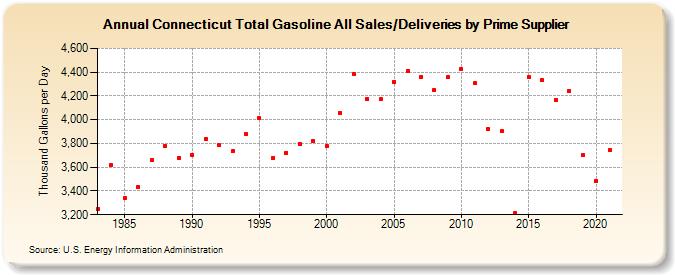
| Connecticut Total Gasoline All Sales/Deliveries by Prime Supplier (Thousand Gallons per Day) | ||||||||
| Decade | Year-0 | Year-1 | Year-2 | Year-3 | Year-4 | Year-5 | Year-6 | Year-7 | Year-8 | Year-9 |
|---|---|---|---|---|---|---|---|---|---|---|
| 1980's | 3,249.6 | 3,618.1 | 3,337.7 | 3,433.4 | 3,658.2 | 3,780.3 | 3,678.1 | |||
| 1990's | 3,705.7 | 3,838.4 | 3,783.0 | 3,732.6 | 3,880.5 | 4,012.8 | 3,678.5 | 3,722.6 | 3,797.3 | 3,820.0 |
| 2000's | 3,779.2 | 4,059.2 | 4,388.4 | 4,172.1 | 4,171.2 | 4,319.4 | 4,409.1 | 4,360.7 | 4,246.8 | 4,355.4 |
| 2010's | 4,425.7 | 4,305.0 | 3,921.4 | 3,902.6 | 3,216.1 | 4,357.3 | 4,331.0 | 4,167.7 | 4,242.4 | 3,700.9 |
| 2020's | 3,484.1 |
| - = No Data Reported; -- = Not Applicable; NA = Not Available; W = Withheld to avoid disclosure of individual company data. |
| Release Date: 6/1/2022 |
| Next Release Date: TBD |