|
Download Data (XLS File) |
|
||||||||
|
||||||||
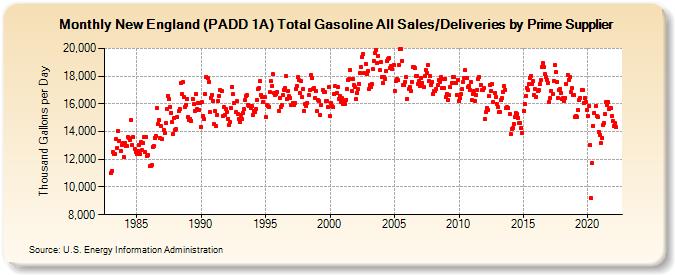
| New England (PADD 1A) Total Gasoline All Sales/Deliveries by Prime Supplier (Thousand Gallons per Day) | ||||||||
| Year | Jan | Feb | Mar | Apr | May | Jun | Jul | Aug | Sep | Oct | Nov | Dec |
|---|---|---|---|---|---|---|---|---|---|---|---|---|
| 1983 | 10,989.5 | 11,178.9 | 12,526.0 | 12,391.7 | 12,402.4 | 13,459.9 | 12,838.4 | 14,049.4 | 13,338.9 | 12,583.7 | 13,017.6 | 13,150.4 |
| 1984 | 12,141.6 | 13,190.6 | 12,948.9 | 12,973.1 | 13,585.1 | 13,509.9 | 13,404.1 | 14,867.5 | 13,041.6 | 13,606.3 | 12,774.8 | 12,551.5 |
| 1985 | 12,367.0 | 12,622.2 | 13,064.6 | 12,344.6 | 13,247.5 | 12,648.4 | 13,206.7 | 13,631.3 | 12,498.5 | 13,613.2 | 12,261.2 | 12,286.7 |
| 1986 | 11,480.2 | 11,495.9 | 11,582.5 | 12,894.1 | 12,964.2 | 13,559.4 | 13,685.1 | 15,670.7 | 14,536.0 | 14,803.4 | 13,527.2 | 14,366.3 |
| 1987 | 13,449.9 | 14,119.9 | 13,882.0 | 14,610.2 | 15,615.1 | 16,567.9 | 16,336.8 | 15,736.0 | 15,364.8 | 14,672.3 | 13,847.8 | 14,966.2 |
| 1988 | 14,094.5 | 14,178.6 | 15,037.1 | 15,458.6 | 15,591.1 | 17,484.8 | 16,714.4 | 17,554.4 | 16,526.7 | 15,796.6 | 15,941.8 | 16,377.2 |
| 1989 | 15,057.4 | 14,853.0 | 14,928.3 | 14,765.0 | 16,377.7 | 15,959.9 | 15,487.6 | 16,717.1 | 15,626.0 | 16,067.0 | 15,583.1 | 16,066.4 |
| 1990 | 14,341.9 | 16,112.3 | 15,145.2 | 14,903.5 | 16,691.5 | 17,948.4 | 17,837.7 | 17,591.0 | 15,392.9 | 16,456.8 | 16,664.2 | 16,215.9 |
| 1991 | 14,521.1 | 15,473.0 | 14,385.4 | 15,226.8 | 16,210.4 | 16,596.8 | 16,988.2 | 16,899.7 | 15,100.2 | 15,795.7 | 15,227.5 | 15,636.9 |
| 1992 | 15,423.1 | 14,934.4 | 14,467.4 | 14,668.5 | 15,727.2 | 17,225.7 | 16,688.9 | 16,045.9 | 15,399.8 | 16,191.5 | 15,263.6 | 14,877.3 |
| 1993 | 14,661.5 | 15,224.5 | 14,883.4 | 15,362.2 | 15,598.6 | 16,262.1 | 16,565.5 | 16,615.4 | 15,943.5 | 15,823.7 | 15,724.6 | 15,852.9 |
| 1994 | 15,181.2 | 15,450.3 | 15,436.5 | 15,609.8 | 16,270.2 | 17,035.5 | 17,145.9 | 17,623.1 | 16,607.3 | 16,504.5 | 16,162.8 | 16,480.5 |
| 1995 | 15,016.1 | 15,927.4 | 15,851.8 | 15,790.4 | 16,821.9 | 17,633.4 | 17,299.1 | 18,130.5 | 16,789.9 | 16,665.6 | 16,716.5 | 16,888.5 |
| 1996 | 15,468.5 | 16,417.4 | 15,802.0 | 15,919.4 | 16,615.7 | 17,008.0 | 17,117.2 | 17,972.3 | 16,327.7 | 16,909.8 | 16,540.4 | 16,394.4 |
| 1997 | 15,907.9 | 16,053.1 | 15,902.3 | 16,082.5 | 17,058.0 | 17,279.6 | 17,912.2 | 17,726.8 | 16,795.8 | 17,646.6 | 16,482.4 | 17,068.1 |
| 1998 | 15,513.0 | 15,974.4 | 15,823.5 | 16,082.5 | 16,607.5 | 16,964.2 | 18,063.0 | 17,835.1 | 17,095.9 | 17,128.6 | 16,440.7 | 16,936.4 |
| 1999 | 15,446.9 | 16,263.4 | 16,186.7 | 15,189.4 | 15,898.8 | 16,976.7 | 16,880.3 | 16,846.0 | 16,200.5 | 16,214.1 | 15,777.2 | 17,221.6 |
| 2000 | 15,088.4 | 16,049.3 | 15,848.2 | 15,752.3 | 16,696.4 | 17,255.3 | 16,771.0 | 17,221.8 | 16,353.8 | 16,580.8 | 16,167.9 | 16,384.9 |
| 2001 | 15,983.5 | 16,228.6 | 16,017.5 | 16,309.8 | 17,048.4 | 17,704.4 | 17,818.7 | 18,431.1 | 16,928.5 | 17,803.6 | 17,338.4 | 17,179.1 |
| 2002 | 16,312.8 | 16,803.2 | 17,044.1 | 17,459.3 | 18,252.2 | 18,644.7 | 19,365.5 | 19,601.2 | 18,231.3 | 18,887.6 | 18,147.2 | 18,389.2 |
| 2003 | 17,034.3 | 17,332.5 | 17,218.1 | 17,458.1 | 18,488.8 | 19,062.2 | 19,699.0 | 19,873.2 | 18,980.0 | 19,458.6 | 18,429.1 | 18,986.3 |
| 2004 | 17,916.8 | 17,492.6 | 17,935.4 | 17,779.0 | 18,351.6 | 19,060.4 | 19,259.0 | 19,285.5 | 18,613.6 | 18,703.4 | 18,526.8 | 18,837.3 |
| 2005 | 16,932.5 | 17,642.1 | 17,755.8 | 17,696.3 | 18,815.7 | 19,927.3 | 19,979.9 | 19,123.3 | 17,329.4 | 17,336.0 | 17,600.2 | 17,912.0 |
| 2006 | 16,379.7 | 17,058.5 | 17,231.3 | 16,897.7 | 17,597.0 | 18,644.2 | 18,670.7 | 18,566.9 | 17,990.9 | 18,027.3 | 17,463.6 | 17,620.3 |
| 2007 | 17,272.3 | 17,854.8 | 17,503.6 | 17,226.9 | 17,978.3 | 18,469.7 | 18,225.7 | 18,780.7 | 17,615.2 | 17,978.0 | 17,326.2 | 17,576.4 |
| 2008 | 16,695.1 | 16,951.9 | 16,895.2 | 17,093.0 | 17,329.8 | 17,687.8 | 17,570.1 | 17,912.2 | 17,113.7 | 17,762.6 | 17,135.0 | 17,762.9 |
| 2009 | 16,524.2 | 16,710.5 | 16,292.6 | 16,612.4 | 17,187.5 | 17,521.2 | 17,928.6 | 17,932.0 | 17,533.5 | 17,475.5 | 16,670.3 | 17,728.6 |
| 2010 | 16,185.2 | 16,392.1 | 16,684.9 | 17,058.6 | 17,608.8 | 17,843.9 | 18,416.5 | 17,886.4 | 17,194.7 | 17,296.7 | 17,007.5 | 17,588.0 |
| 2011 | 16,264.1 | 16,733.5 | 16,958.0 | 16,209.4 | 16,612.4 | 17,015.2 | 17,781.5 | 17,919.7 | 17,370.8 | 17,003.3 | 16,976.0 | 17,121.4 |
| 2012 | 14,874.4 | 15,390.7 | 15,726.3 | 15,581.5 | 16,585.8 | 17,344.2 | 16,947.4 | 17,438.9 | 16,119.8 | 16,792.4 | 16,498.5 | 16,014.6 |
| 2013 | 15,772.1 | 15,383.0 | 15,393.0 | 16,290.9 | 16,389.7 | 16,865.8 | 17,252.5 | 17,023.4 | 15,696.1 | 15,748.1 | 15,689.0 | 15,244.2 |
| 2014 | 13,792.8 | 14,204.4 | 14,272.4 | 14,531.7 | 15,049.8 | 15,332.3 | 15,292.4 | 15,013.5 | 14,606.5 | 14,634.1 | 14,281.4 | 13,926.8 |
| 2015 | 15,481.2 | 16,008.1 | 16,551.4 | 17,173.2 | 16,963.4 | 17,401.7 | 17,894.0 | 18,041.7 | 17,396.2 | 17,611.8 | 16,635.9 | 17,040.4 |
| 2016 | 16,507.5 | 16,900.9 | 16,992.0 | 17,403.7 | 17,685.5 | 18,678.4 | 18,949.0 | 18,624.8 | 18,121.3 | 17,904.8 | 17,751.9 | 17,503.7 |
| 2017 | 16,112.2 | 16,419.1 | 16,916.9 | 16,720.4 | 17,634.3 | 18,804.1 | 18,269.9 | 17,575.5 | 16,402.3 | 16,995.6 | 17,071.9 | 16,769.5 |
| 2018 | 16,350.0 | 16,421.4 | 16,205.7 | 16,406.1 | 17,464.4 | 18,112.4 | 17,749.0 | 17,956.2 | 16,828.3 | 17,138.3 | 16,669.8 | 16,608.2 |
| 2019 | 15,050.5 | 15,134.8 | 15,019.4 | 15,541.1 | 16,308.9 | 16,450.0 | 17,025.6 | 16,995.2 | 16,043.6 | 16,404.5 | 16,128.5 | 15,584.2 |
| 2020 | 15,110.1 | 15,831.1 | 13,042.4 | 9,190.0 | 11,702.5 | 14,426.3 | 15,363.8 | 15,814.0 | 15,155.2 | 15,032.0 | 13,958.2 | 13,770.1 |
| 2021 | 13,181.6 | 13,556.8 | 14,459.6 | 14,602.4 | 15,234.9 | 16,139.0 | 15,888.7 | 16,125.0 | 15,591.4 | 15,699.9 | 15,109.2 | 14,769.2 |
| 2022 | 14,403.2 | 14,585.2 | 14,310.9 | |||||||||
| - = No Data Reported; -- = Not Applicable; NA = Not Available; W = Withheld to avoid disclosure of individual company data. |
| Release Date: 5/19/2022 |
| Next Release Date: TBD |