|
Download Data (XLS File) |
|
||||||||
|
||||||||
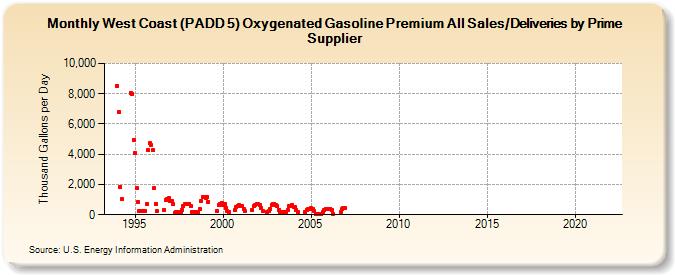
| West Coast (PADD 5) Oxygenated Gasoline Premium All Sales/Deliveries by Prime Supplier (Thousand Gallons per Day) | ||||||||
| Year | Jan | Feb | Mar | Apr | May | Jun | Jul | Aug | Sep | Oct | Nov | Dec |
|---|---|---|---|---|---|---|---|---|---|---|---|---|
| 1993 | NA | NA | NA | |||||||||
| 1994 | 8,516.5 | 6,807.9 | 1,852.0 | 1,033.9 | W | W | W | W | W | 8,060.9 | 7,994.0 | 4,942.5 |
| 1995 | 4,101.5 | 1,765.4 | 861.8 | 243.4 | 236.8 | 233.3 | 232.7 | 242.1 | 702.9 | 4,258.1 | 4,714.6 | 4,625.4 |
| 1996 | 4,252.7 | 1,748.3 | 704.4 | 220.8 | W | W | W | NA | 323.8 | 993.9 | 1,067.3 | 1,103.9 |
| 1997 | 921.4 | 886.5 | 688.2 | 136.8 | 189.4 | 191.9 | 186.2 | 193.9 | 326.4 | 572.7 | 680.0 | 732.5 |
| 1998 | 687.9 | 728.8 | 577.7 | 206.4 | 188.3 | 190.1 | W | 199.7 | 371.4 | 897.2 | 1,155.7 | 1,151.1 |
| 1999 | 1,130.2 | 1,151.8 | 867.5 | W | W | W | W | W | 260.2 | 645.2 | 734.4 | 801.1 |
| 2000 | 610.7 | 707.0 | 432.6 | 213.3 | 188.4 | W | W | W | 326.9 | 541.6 | 606.8 | 636.2 |
| 2001 | 543.8 | 567.7 | 378.4 | 224.9 | W | W | W | W | 333.5 | 583.4 | 665.4 | 706.3 |
| 2002 | 686.3 | 649.5 | 456.0 | 240.2 | W | W | 198.2 | 212.7 | 382.7 | 666.4 | 711.3 | 711.5 |
| 2003 | 648.2 | 554.8 | 338.9 | 183.5 | 188.1 | 211.8 | 206.2 | 210.4 | 322.1 | 545.2 | 601.2 | 618.3 |
| 2004 | 540.9 | 494.6 | 328.0 | 171.5 | W | W | W | W | 176.9 | 338.2 | 364.5 | 400.7 |
| 2005 | 422.3 | 400.7 | 262.0 | 53.9 | 24.2 | 28.3 | 28.5 | 27.5 | 150.7 | 318.7 | 393.2 | 402.3 |
| 2006 | 400.7 | 395.3 | 289.0 | 58.5 | W | W | W | W | 174.4 | 365.6 | 429.2 | 424.6 |
| 2007 | - | - | - | - | - | - | - | - | - | - | - | - |
| 2008 | - | - | - | - | - | - | - | - | - | - | - | - |
| 2009 | - | - | - | - | - | - | - | - | - | - | - | - |
| 2010 | - | - | - | - | - | - | - | - | - | - | - | - |
| 2011 | - | - | - | - | - | - | - | - | - | - | - | - |
| 2012 | - | - | - | - | - | - | - | - | - | - | - | - |
| 2013 | - | - | - | - | - | - | - | - | - | - | - | - |
| 2014 | - | - | - | - | - | - | - | - | - | - | - | - |
| 2015 | - | - | - | - | - | - | - | - | - | - | - | - |
| 2016 | - | - | - | - | - | - | - | - | - | - | - | - |
| 2017 | - | - | - | - | - | - | - | - | - | - | - | - |
| 2018 | - | - | - | - | - | - | - | - | - | - | - | - |
| 2019 | - | - | - | - | - | - | - | - | - | - | - | - |
| 2020 | - | - | - | - | - | - | - | - | - | - | - | - |
| 2021 | - | - | - | - | - | - | - | - | - | - | - | - |
| 2022 | - | - | - | |||||||||
| - = No Data Reported; -- = Not Applicable; NA = Not Available; W = Withheld to avoid disclosure of individual company data. |
| Release Date: 5/19/2022 |
| Next Release Date: TBD |