|
Download Data (XLS File) |
|
||||||||
|
||||||||
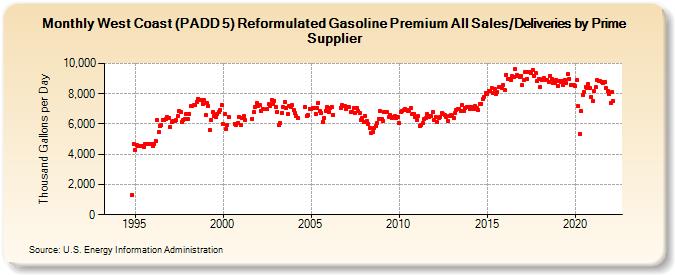
| West Coast (PADD 5) Reformulated Gasoline Premium All Sales/Deliveries by Prime Supplier (Thousand Gallons per Day) | ||||||||
| Year | Jan | Feb | Mar | Apr | May | Jun | Jul | Aug | Sep | Oct | Nov | Dec |
|---|---|---|---|---|---|---|---|---|---|---|---|---|
| 1993 | - | - | - | |||||||||
| 1994 | - | - | - | - | - | - | - | - | - | - | 1,316.9 | 4,666.9 |
| 1995 | 4,269.9 | 4,599.4 | 4,524.4 | 4,537.1 | 4,520.3 | 4,569.2 | 4,491.5 | 4,703.1 | 4,666.8 | 4,658.4 | 4,670.7 | 4,643.7 |
| 1996 | 4,537.5 | 4,673.9 | 4,888.3 | 6,287.8 | 5,440.6 | 5,896.2 | 5,932.4 | 6,295.6 | 6,235.0 | 6,341.3 | 6,455.6 | 6,427.7 |
| 1997 | 5,807.5 | 6,116.0 | 6,180.6 | 6,188.1 | 6,234.6 | 6,508.3 | 6,883.1 | 6,809.7 | 6,155.0 | 6,252.9 | 6,360.6 | 6,668.2 |
| 1998 | 6,296.4 | 6,681.5 | 7,164.4 | 7,200.9 | 7,228.4 | 7,236.8 | 7,471.5 | 7,660.3 | 7,565.0 | 7,574.4 | 7,343.4 | 7,560.1 |
| 1999 | 6,580.7 | 7,375.8 | 7,192.5 | 5,625.6 | 6,251.7 | 6,780.7 | 6,538.2 | 6,477.6 | 6,668.7 | 6,818.4 | 6,915.9 | 7,279.8 |
| 2000 | 5,971.0 | 6,656.8 | 5,661.0 | 5,946.5 | 6,445.5 | W | W | W | 6,018.3 | 5,932.7 | 6,084.6 | 6,473.4 |
| 2001 | 5,946.5 | 6,426.2 | 6,512.0 | 6,254.4 | W | W | W | W | 6,354.5 | 6,786.0 | 7,146.8 | 7,403.3 |
| 2002 | 7,189.7 | 7,223.6 | 6,878.1 | 7,017.8 | W | W | 6,960.3 | 7,298.7 | 7,215.3 | 7,612.4 | 7,350.1 | 7,547.4 |
| 2003 | 7,145.1 | 6,807.9 | 5,903.5 | 6,061.8 | 6,734.0 | 7,089.7 | 7,437.7 | 7,029.8 | 6,636.0 | 7,204.7 | 7,140.7 | 7,238.0 |
| 2004 | 6,925.1 | 6,708.0 | 6,512.1 | 6,404.7 | W | W | W | W | 7,105.2 | 6,558.4 | 6,562.1 | 6,999.9 |
| 2005 | 7,014.7 | 7,069.9 | 7,079.1 | 6,692.3 | 7,046.1 | 7,410.1 | 6,870.3 | 6,742.0 | 6,154.5 | 6,402.0 | 6,879.8 | 7,126.4 |
| 2006 | 6,790.2 | 7,079.1 | 7,135.9 | 6,613.3 | W | W | W | W | 7,071.9 | 7,233.1 | 7,168.5 | 7,218.2 |
| 2007 | 6,966.5 | 7,105.5 | 7,093.6 | 6,760.7 | 6,814.0 | 7,087.7 | 6,751.2 | 7,061.7 | 6,865.8 | 6,713.2 | 6,277.5 | 6,414.9 |
| 2008 | 6,101.3 | 6,527.0 | 6,226.2 | 6,015.9 | 5,756.8 | 5,412.6 | 5,453.3 | 5,743.3 | 5,863.1 | 6,066.9 | 6,333.6 | 6,848.7 |
| 2009 | 6,324.5 | 6,209.6 | 6,765.8 | 6,771.3 | 6,774.2 | 6,448.0 | 6,602.3 | 6,372.1 | 6,444.1 | 6,504.0 | 6,366.0 | 6,483.2 |
| 2010 | 6,041.4 | 6,819.4 | 6,869.1 | 6,891.2 | 6,981.1 | 6,909.2 | 6,828.1 | 6,893.3 | 7,072.0 | 6,669.5 | 6,666.5 | 6,465.3 |
| 2011 | 6,292.1 | 6,501.0 | 5,878.2 | 5,942.0 | 6,034.4 | 6,304.0 | 6,369.4 | 6,660.9 | 6,461.7 | 6,514.0 | 6,497.3 | 6,795.2 |
| 2012 | 6,241.9 | 6,430.6 | 6,113.3 | 6,377.9 | 6,484.0 | 6,709.8 | 6,640.0 | 6,591.3 | 6,479.1 | 6,224.0 | 6,499.2 | 6,570.0 |
| 2013 | 6,515.4 | 6,395.1 | 6,721.5 | 6,937.4 | 6,990.2 | 6,992.6 | 6,877.5 | 7,232.6 | 6,847.4 | 7,073.0 | 7,134.5 | 7,141.9 |
| 2014 | 6,980.0 | 7,154.3 | 7,067.3 | 7,008.3 | 7,174.7 | 7,039.9 | 6,933.4 | 7,314.5 | 7,342.6 | 7,651.1 | 7,792.0 | 8,068.1 |
| 2015 | 7,965.5 | 8,169.6 | 8,154.2 | 8,394.9 | 8,016.1 | 8,281.4 | 7,978.3 | 8,121.4 | 8,412.6 | 8,466.5 | 8,390.5 | 8,573.6 |
| 2016 | 8,218.7 | 9,264.0 | 8,960.1 | 8,997.5 | 8,881.9 | 9,147.0 | 9,080.8 | 9,602.2 | 9,231.8 | 9,184.4 | 9,119.4 | 9,176.3 |
| 2017 | 8,557.3 | 8,931.0 | 9,452.5 | 8,978.6 | 9,408.5 | 9,425.9 | 9,349.0 | 9,584.2 | 9,184.2 | 9,345.6 | 8,827.7 | 9,006.2 |
| 2018 | 8,418.5 | 8,913.6 | 8,990.2 | 9,023.6 | 8,930.5 | 8,917.8 | 8,803.7 | 9,189.1 | 8,993.3 | 8,725.9 | 8,732.9 | 8,931.8 |
| 2019 | 8,539.8 | 8,852.1 | 8,801.9 | 8,873.9 | 8,602.5 | 8,926.5 | 8,716.7 | 9,273.8 | 8,996.8 | 8,585.2 | 8,552.9 | 8,553.8 |
| 2020 | 8,525.6 | 8,889.1 | 7,192.3 | 5,340.0 | 6,843.0 | 7,896.0 | 8,110.1 | 8,444.4 | 8,400.3 | 8,639.1 | 8,363.8 | 7,798.1 |
| 2021 | 7,540.0 | 8,147.4 | 8,413.5 | 8,928.7 | 8,866.1 | 8,851.3 | 8,765.0 | 8,737.5 | 8,762.2 | 8,407.1 | 8,212.3 | 8,014.3 |
| 2022 | 7,395.3 | 8,142.0 | 7,512.5 | |||||||||
| - = No Data Reported; -- = Not Applicable; NA = Not Available; W = Withheld to avoid disclosure of individual company data. |
| Release Date: 5/19/2022 |
| Next Release Date: TBD |