|
Download Data (XLS File) |
|
||||||||
|
||||||||
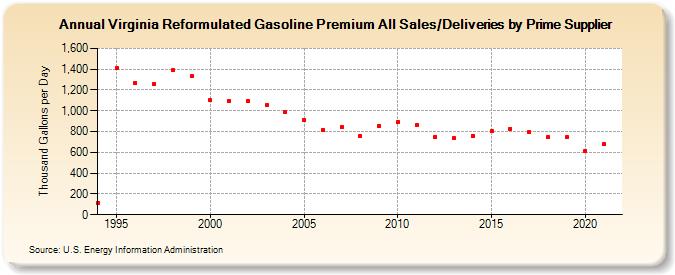
| Virginia Reformulated Gasoline Premium All Sales/Deliveries by Prime Supplier (Thousand Gallons per Day) | ||||||||
| Decade | Year-0 | Year-1 | Year-2 | Year-3 | Year-4 | Year-5 | Year-6 | Year-7 | Year-8 | Year-9 |
|---|---|---|---|---|---|---|---|---|---|---|
| 1990's | 112.7 | 1,409.4 | 1,267.9 | 1,258.1 | 1,390.4 | 1,331.4 | ||||
| 2000's | 1,099.6 | 1,094.7 | 1,089.3 | 1,051.0 | 988.0 | 910.3 | 813.8 | 845.3 | 755.3 | 854.3 |
| 2010's | 891.7 | 860.6 | 748.6 | 734.5 | 760.3 | 805.6 | 829.2 | 791.2 | 749.3 | 744.9 |
| 2020's | 615.3 |
| - = No Data Reported; -- = Not Applicable; NA = Not Available; W = Withheld to avoid disclosure of individual company data. |
| Release Date: 6/1/2022 |
| Next Release Date: TBD |