|
Download Data (XLS File) |
|
||||||||
|
||||||||
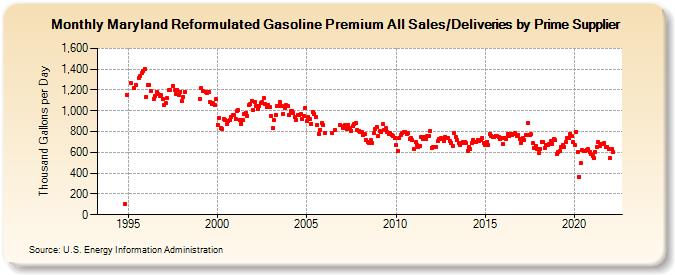
| Maryland Reformulated Gasoline Premium All Sales/Deliveries by Prime Supplier (Thousand Gallons per Day) | ||||||||
| Year | Jan | Feb | Mar | Apr | May | Jun | Jul | Aug | Sep | Oct | Nov | Dec |
|---|---|---|---|---|---|---|---|---|---|---|---|---|
| 1993 | - | - | - | |||||||||
| 1994 | - | - | - | - | - | - | - | - | - | - | 98.9 | 1,156.4 |
| 1995 | W | W | 1,263.9 | W | 1,220.0 | 1,247.7 | W | 1,312.9 | 1,337.5 | 1,366.9 | 1,386.6 | 1,405.2 |
| 1996 | 1,132.7 | 1,248.9 | 1,246.5 | 1,192.9 | W | 1,117.8 | 1,144.3 | 1,184.2 | 1,161.1 | 1,142.3 | 1,146.9 | 1,109.8 |
| 1997 | 1,056.4 | 1,071.7 | 1,121.1 | 1,196.1 | 1,198.2 | W | 1,240.2 | 1,197.3 | 1,158.9 | 1,199.9 | 1,154.1 | 1,184.5 |
| 1998 | 1,092.0 | 1,133.3 | 1,183.9 | W | W | W | W | W | W | W | W | W |
| 1999 | 1,116.4 | 1,216.0 | 1,186.4 | W | 1,179.6 | 1,171.0 | 1,176.0 | 1,080.0 | 1,066.4 | 1,073.8 | 1,055.7 | 1,110.9 |
| 2000 | 866.1 | 935.0 | 830.4 | 825.0 | 919.3 | 914.0 | 872.9 | 902.2 | 910.5 | 944.7 | 956.7 | 955.7 |
| 2001 | 921.1 | 1,000.4 | 1,003.5 | 907.9 | 877.4 | 907.8 | 966.8 | 983.1 | 948.0 | 1,051.8 | 1,064.9 | 1,094.1 |
| 2002 | 1,004.0 | 1,089.0 | 1,048.4 | 1,017.1 | 1,049.5 | 1,076.4 | 1,083.0 | 1,120.9 | 1,063.4 | 1,036.1 | 1,058.0 | 1,031.5 |
| 2003 | 952.0 | 832.3 | 912.7 | 960.0 | 1,045.0 | 1,048.0 | 1,086.1 | 1,042.2 | 972.1 | 1,029.4 | 1,051.1 | 1,041.7 |
| 2004 | 962.9 | 996.2 | 1,001.4 | 981.8 | 939.4 | 913.6 | 961.3 | 955.2 | 968.7 | 919.7 | 948.5 | 1,031.1 |
| 2005 | 898.9 | 941.5 | 921.6 | 875.8 | 986.2 | 971.9 | 936.0 | 864.7 | 777.8 | 816.1 | 877.8 | 859.2 |
| 2006 | 788.4 | W | W | W | W | 784.9 | W | 816.0 | W | W | 858.7 | W |
| 2007 | 838.1 | 854.6 | 865.1 | 827.2 | 865.6 | 833.3 | 808.0 | 849.7 | 875.7 | 883.1 | 815.6 | 805.6 |
| 2008 | 791.0 | 798.0 | 763.2 | 772.7 | 716.4 | 698.5 | 685.6 | 720.3 | 694.1 | 781.6 | 827.0 | 846.7 |
| 2009 | 759.5 | 803.6 | 798.8 | 869.4 | 819.5 | 830.7 | 791.1 | 777.1 | 784.0 | 770.9 | 756.7 | 734.2 |
| 2010 | 670.0 | 609.5 | 734.5 | 762.8 | 786.5 | 792.5 | 799.0 | 775.1 | 782.7 | 728.8 | 738.7 | 718.7 |
| 2011 | 634.3 | 698.6 | 673.8 | 649.9 | 665.2 | 748.4 | 731.7 | 751.4 | 726.6 | 754.5 | 758.1 | 800.7 |
| 2012 | 643.2 | 654.3 | 656.0 | 652.0 | 705.0 | 730.3 | 737.1 | 725.6 | 708.4 | 745.9 | 734.2 | 739.0 |
| 2013 | 708.4 | 691.2 | 660.6 | 782.2 | 751.5 | 720.1 | 690.3 | 673.5 | 693.4 | 696.0 | 703.7 | 686.6 |
| 2014 | 617.7 | 649.3 | 629.5 | 688.9 | 722.7 | 698.7 | 700.4 | 719.0 | 707.6 | 717.5 | 738.2 | 685.1 |
| 2015 | 671.3 | 702.1 | 668.2 | 772.0 | 762.0 | 743.1 | 746.1 | 761.6 | 754.1 | 751.3 | 725.5 | 735.1 |
| 2016 | 684.5 | 741.5 | 731.7 | 771.8 | 754.9 | 779.1 | 764.2 | 774.0 | 789.1 | 760.3 | 770.6 | 732.5 |
| 2017 | 689.6 | 737.7 | 718.0 | 764.6 | 765.6 | 881.8 | 763.4 | 773.8 | 686.7 | 645.6 | 661.3 | 632.5 |
| 2018 | 594.3 | 635.9 | 702.0 | 700.8 | 645.9 | 671.6 | 673.9 | 677.5 | 705.2 | 682.9 | 732.7 | 716.5 |
| 2019 | 579.6 | 602.9 | 615.1 | 652.2 | 670.5 | 646.8 | 696.7 | 742.5 | 739.6 | 780.1 | 758.3 | 702.7 |
| 2020 | 668.5 | 796.9 | 603.9 | 362.7 | 493.6 | 623.3 | 614.8 | 609.1 | 623.2 | 628.8 | 599.5 | 581.3 |
| 2021 | 562.7 | 543.0 | 607.5 | 655.3 | 700.5 | 660.4 | 680.3 | 676.2 | 685.4 | 655.1 | 652.4 | 628.0 |
| 2022 | 544.9 | 632.9 | 599.4 | |||||||||
| - = No Data Reported; -- = Not Applicable; NA = Not Available; W = Withheld to avoid disclosure of individual company data. |
| Release Date: 5/19/2022 |
| Next Release Date: TBD |