|
Download Data (XLS File) |
|
||||||||
|
||||||||
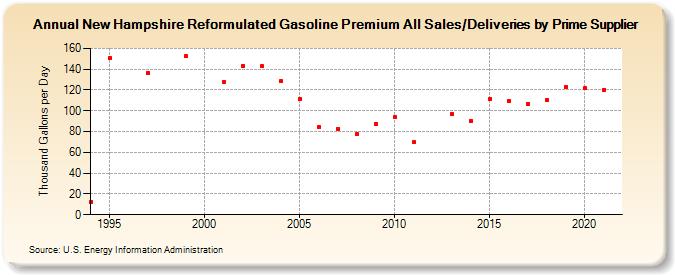
| New Hampshire Reformulated Gasoline Premium All Sales/Deliveries by Prime Supplier (Thousand Gallons per Day) | ||||||||
| Decade | Year-0 | Year-1 | Year-2 | Year-3 | Year-4 | Year-5 | Year-6 | Year-7 | Year-8 | Year-9 |
|---|---|---|---|---|---|---|---|---|---|---|
| 1990's | 12.5 | 150.7 | W | 136.6 | W | 152.4 | ||||
| 2000's | W | 128.1 | 143.5 | 142.6 | 128.6 | 111.1 | 84.5 | 82.9 | 77.2 | 87.6 |
| 2010's | 93.7 | 69.6 | W | 96.9 | 90.5 | 111.3 | 109.6 | 106.7 | 110.6 | 123.0 |
| 2020's | 121.6 |
| - = No Data Reported; -- = Not Applicable; NA = Not Available; W = Withheld to avoid disclosure of individual company data. |
| Release Date: 6/1/2022 |
| Next Release Date: TBD |