|
Download Data (XLS File) |
|
||||||||
|
||||||||
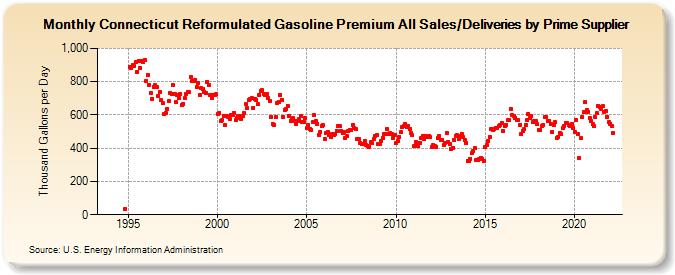
| Connecticut Reformulated Gasoline Premium All Sales/Deliveries by Prime Supplier (Thousand Gallons per Day) | ||||||||
| Year | Jan | Feb | Mar | Apr | May | Jun | Jul | Aug | Sep | Oct | Nov | Dec |
|---|---|---|---|---|---|---|---|---|---|---|---|---|
| 1993 | - | - | - | |||||||||
| 1994 | - | - | - | - | - | - | - | - | - | - | 35.0 | W |
| 1995 | W | 890.0 | 884.7 | 900.4 | 894.2 | 920.5 | 860.0 | 926.0 | 880.7 | 924.2 | 920.3 | 930.9 |
| 1996 | 805.8 | 841.3 | 782.3 | 730.1 | 698.2 | 770.1 | 777.5 | 769.1 | 715.3 | 738.1 | 687.7 | 669.4 |
| 1997 | 604.7 | 613.7 | 638.3 | 683.5 | 734.0 | 726.0 | 779.0 | 722.8 | 675.1 | 722.2 | 701.5 | 725.2 |
| 1998 | 656.7 | 668.0 | 699.7 | 727.4 | 740.7 | 735.4 | 829.6 | 804.4 | 804.6 | 811.3 | 770.7 | 794.7 |
| 1999 | 717.2 | 759.6 | 753.1 | 739.2 | 733.9 | 800.3 | 780.0 | 720.0 | 700.4 | 720.3 | 718.5 | 723.2 |
| 2000 | 608.4 | 609.8 | 563.9 | 567.9 | 595.1 | 537.3 | 594.0 | 589.0 | 577.6 | 600.9 | 600.9 | 613.9 |
| 2001 | 566.9 | 580.1 | 591.7 | 594.7 | 574.0 | 596.0 | 609.9 | 666.3 | 639.5 | 691.8 | 697.5 | 699.8 |
| 2002 | 642.0 | 697.8 | 688.7 | 662.7 | 721.9 | 742.8 | 747.8 | 724.8 | 720.7 | 724.3 | 700.2 | 686.5 |
| 2003 | 586.4 | 546.7 | 538.0 | 584.7 | 674.6 | 679.2 | 720.3 | 691.6 | 587.8 | 630.1 | 635.9 | 655.7 |
| 2004 | 594.0 | 566.3 | 573.5 | 579.1 | 564.3 | 545.3 | 564.6 | 573.4 | 592.6 | 556.7 | 557.2 | 580.3 |
| 2005 | 520.9 | 539.0 | 517.9 | 510.9 | 555.8 | 602.1 | 562.9 | 546.5 | 478.1 | 496.8 | 534.0 | 537.4 |
| 2006 | 455.1 | 490.3 | 497.0 | 477.5 | 469.6 | 486.5 | 476.8 | 484.7 | 505.4 | 535.7 | 530.9 | 501.4 |
| 2007 | 492.5 | 499.6 | 464.2 | 470.4 | 500.7 | 510.3 | 506.6 | 540.4 | 521.9 | 513.5 | 452.3 | 454.6 |
| 2008 | 432.2 | 424.9 | 427.5 | 443.4 | 419.6 | 414.0 | 408.3 | 434.2 | 428.9 | 457.4 | 473.6 | 477.7 |
| 2009 | 423.3 | 426.8 | 442.2 | 462.9 | 486.6 | 483.9 | 516.0 | 486.5 | 491.2 | 483.7 | 463.5 | 481.7 |
| 2010 | 430.4 | 445.6 | 464.4 | 494.6 | 525.0 | 533.9 | 546.6 | 524.8 | 533.5 | 514.9 | 491.7 | 477.2 |
| 2011 | 411.4 | 439.4 | 427.5 | 412.3 | 432.9 | 459.9 | 471.8 | 454.0 | 470.7 | 468.2 | 473.2 | 466.2 |
| 2012 | 408.9 | 416.8 | 414.3 | 408.8 | 461.2 | 473.9 | 449.5 | 450.1 | 420.9 | 433.1 | 492.9 | 438.4 |
| 2013 | 424.2 | 393.9 | 402.4 | 447.9 | 475.0 | 476.9 | 457.6 | 474.5 | 487.9 | 465.7 | 450.7 | 431.2 |
| 2014 | 325.9 | 324.7 | 337.0 | 368.3 | 383.0 | 399.3 | 329.5 | 331.0 | 332.0 | 343.2 | 337.8 | 324.5 |
| 2015 | 405.3 | 417.9 | 443.8 | 468.9 | 513.2 | 508.7 | 512.5 | 519.9 | 519.4 | 531.8 | 537.8 | 552.4 |
| 2016 | 503.1 | 536.2 | 540.9 | 568.8 | 567.0 | 637.1 | 598.2 | 594.1 | 583.4 | 570.0 | 567.7 | 540.9 |
| 2017 | 482.9 | 504.1 | 513.4 | 541.1 | 567.9 | 606.3 | 583.7 | 593.0 | 555.0 | 563.3 | 562.3 | 543.6 |
| 2018 | 506.5 | 508.3 | 530.7 | 541.2 | 586.6 | 589.2 | 564.4 | 566.0 | 546.4 | 498.6 | 539.6 | 555.4 |
| 2019 | 462.4 | 468.9 | 493.7 | 483.2 | 519.8 | 535.4 | 553.8 | 550.5 | 541.6 | 536.1 | 546.7 | 519.0 |
| 2020 | 498.0 | 570.5 | 486.8 | 339.0 | 458.6 | 589.8 | 615.7 | 676.4 | 631.8 | 620.0 | 581.9 | 562.4 |
| 2021 | 542.9 | 531.1 | 585.6 | 609.0 | 656.1 | 648.5 | 638.3 | 651.3 | 616.1 | 624.8 | 590.1 | 556.4 |
| 2022 | 547.9 | 536.1 | 489.8 | |||||||||
| - = No Data Reported; -- = Not Applicable; NA = Not Available; W = Withheld to avoid disclosure of individual company data. |
| Release Date: 5/19/2022 |
| Next Release Date: TBD |