|
Download Data (XLS File) |
|
||||||||
|
||||||||
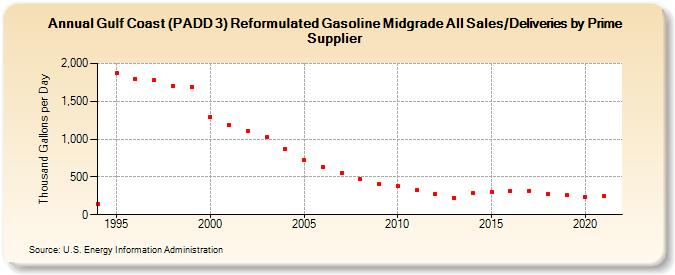
| Gulf Coast (PADD 3) Reformulated Gasoline Midgrade All Sales/Deliveries by Prime Supplier (Thousand Gallons per Day) | ||||||||
| Decade | Year-0 | Year-1 | Year-2 | Year-3 | Year-4 | Year-5 | Year-6 | Year-7 | Year-8 | Year-9 |
|---|---|---|---|---|---|---|---|---|---|---|
| 1990's | 144.0 | 1,867.6 | 1,795.8 | 1,779.7 | 1,700.6 | 1,691.0 | ||||
| 2000's | 1,298.7 | 1,184.8 | 1,111.5 | 1,022.9 | 869.4 | 717.1 | 634.2 | 557.6 | 466.9 | 403.0 |
| 2010's | 374.8 | 325.1 | 273.1 | 225.7 | 289.3 | 297.1 | 315.1 | 317.6 | 278.4 | 262.4 |
| 2020's | 232.9 |
| - = No Data Reported; -- = Not Applicable; NA = Not Available; W = Withheld to avoid disclosure of individual company data. |
| Release Date: 6/1/2022 |
| Next Release Date: TBD |