|
Download Data (XLS File) |
|
||||||||
|
||||||||
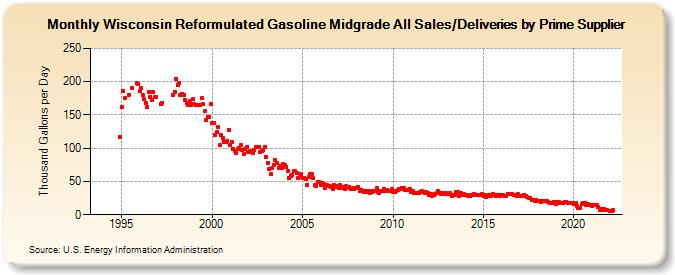
| Wisconsin Reformulated Gasoline Midgrade All Sales/Deliveries by Prime Supplier (Thousand Gallons per Day) | ||||||||
| Year | Jan | Feb | Mar | Apr | May | Jun | Jul | Aug | Sep | Oct | Nov | Dec |
|---|---|---|---|---|---|---|---|---|---|---|---|---|
| 1993 | - | - | - | |||||||||
| 1994 | - | - | - | - | - | - | - | - | - | - | W | 116.4 |
| 1995 | 162.5 | 186.6 | 174.7 | W | W | 180.0 | W | 189.8 | W | W | 197.5 | 196.1 |
| 1996 | 186.5 | 190.0 | 180.0 | 173.2 | 167.4 | 161.8 | 184.2 | 177.5 | 173.0 | 183.9 | 176.7 | 177.1 |
| 1997 | W | W | 166.3 | 168.3 | W | W | W | W | W | W | 179.5 | 184.2 |
| 1998 | 204.6 | 194.8 | 198.1 | 180.6 | 181.5 | 180.5 | 172.1 | 167.4 | 165.0 | 171.1 | 165.0 | 173.6 |
| 1999 | 165.8 | 164.8 | 164.3 | 164.4 | 164.4 | 174.8 | 165.9 | 155.5 | 141.9 | 146.3 | 147.6 | 166.4 |
| 2000 | 137.5 | 137.9 | 119.3 | 124.7 | 131.1 | 104.8 | 120.1 | 115.5 | 109.0 | 109.5 | 111.1 | 127.8 |
| 2001 | 105.4 | 109.0 | 99.4 | 96.0 | 92.7 | 98.8 | 100.5 | 104.6 | 97.2 | 91.4 | 99.4 | 102.3 |
| 2002 | 94.4 | 95.9 | 93.7 | 92.7 | 97.6 | 101.7 | 101.8 | 101.1 | 94.0 | 95.3 | 96.8 | 102.1 |
| 2003 | 87.1 | 78.0 | 68.5 | 61.6 | 70.4 | 75.3 | 81.5 | 78.4 | 69.7 | 73.7 | 70.4 | 75.6 |
| 2004 | 74.8 | 72.3 | 65.3 | 55.9 | 58.8 | 60.1 | 65.5 | 65.5 | 63.0 | 55.1 | 56.9 | 61.8 |
| 2005 | 55.0 | 55.6 | 53.8 | 45.4 | 57.0 | 61.6 | 60.9 | 54.9 | 44.1 | 43.4 | 49.2 | 49.9 |
| 2006 | 44.3 | 47.5 | 45.8 | 39.9 | 44.2 | 43.4 | 42.6 | 41.6 | 37.9 | 44.7 | 42.8 | 42.2 |
| 2007 | 40.2 | 44.3 | 42.1 | 40.1 | 39.0 | 42.9 | 40.6 | 41.2 | 38.2 | 40.5 | 39.3 | 40.0 |
| 2008 | 40.0 | 41.4 | 35.0 | 37.7 | 35.7 | 34.8 | 35.4 | 34.3 | 34.9 | 32.4 | 33.9 | 35.5 |
| 2009 | 35.3 | 39.6 | 34.2 | 33.3 | 35.5 | 36.2 | 38.0 | 35.7 | 36.5 | 35.4 | 35.7 | 38.2 |
| 2010 | 34.2 | 34.8 | 35.0 | 36.4 | 39.1 | 38.8 | 39.5 | 40.0 | 36.4 | 36.6 | 36.9 | 39.2 |
| 2011 | 34.4 | 35.2 | 32.7 | 32.5 | 32.2 | 32.2 | 34.1 | 35.4 | 34.1 | 32.7 | 33.6 | 33.2 |
| 2012 | 29.9 | 30.7 | 27.6 | 29.3 | 31.6 | 32.2 | 35.0 | 33.1 | 31.5 | 33.1 | 31.6 | 32.1 |
| 2013 | 31.7 | 31.2 | 32.2 | 27.4 | 29.9 | 29.4 | 33.5 | 33.8 | 28.0 | 32.0 | 30.3 | 30.5 |
| 2014 | 29.5 | 30.2 | 27.9 | 28.8 | 30.3 | 29.1 | 31.3 | 30.0 | 29.5 | 29.9 | 29.0 | 30.4 |
| 2015 | 27.9 | 29.0 | 27.0 | 27.7 | 28.9 | 28.5 | 31.0 | 29.5 | 28.4 | 28.9 | 29.5 | 27.9 |
| 2016 | 30.3 | 29.0 | 28.4 | 28.1 | 31.2 | 30.7 | 31.6 | 31.2 | 29.6 | 30.0 | 28.6 | 31.0 |
| 2017 | 27.9 | 27.7 | 28.4 | 29.3 | 28.1 | 27.1 | 24.8 | 24.4 | 22.4 | 22.5 | 21.1 | 22.1 |
| 2018 | 20.1 | 20.9 | 19.6 | 19.9 | 20.3 | 20.3 | 20.8 | 19.1 | 17.7 | 18.3 | 18.2 | 18.5 |
| 2019 | 16.5 | 18.5 | 18.5 | 18.3 | 17.9 | 17.9 | 18.5 | 19.2 | 17.5 | 18.3 | 17.9 | 16.9 |
| 2020 | 15.5 | 17.1 | 13.2 | 10.2 | 10.3 | 15.4 | 17.2 | 17.2 | 15.0 | 15.4 | 13.9 | 14.7 |
| 2021 | 13.8 | 14.4 | 15.3 | 15.0 | 11.1 | 7.1 | 8.2 | 7.5 | 9.2 | 7.4 | 7.6 | W |
| 2022 | 6.3 | 6.2 | 7.7 | |||||||||
| - = No Data Reported; -- = Not Applicable; NA = Not Available; W = Withheld to avoid disclosure of individual company data. |
| Release Date: 5/19/2022 |
| Next Release Date: TBD |