|
Download Data (XLS File) |
|
||||||||
|
||||||||
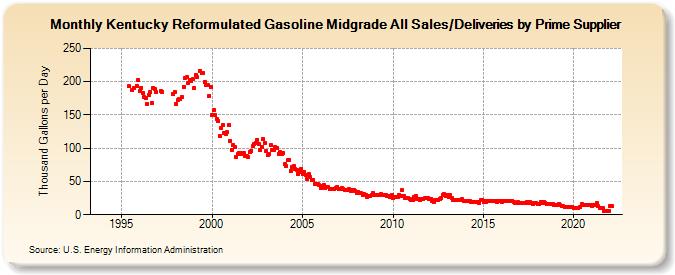
| Kentucky Reformulated Gasoline Midgrade All Sales/Deliveries by Prime Supplier (Thousand Gallons per Day) | ||||||||
| Year | Jan | Feb | Mar | Apr | May | Jun | Jul | Aug | Sep | Oct | Nov | Dec |
|---|---|---|---|---|---|---|---|---|---|---|---|---|
| 1993 | - | - | - | |||||||||
| 1994 | - | - | - | - | - | - | - | - | - | - | W | W |
| 1995 | W | W | W | W | W | 192.9 | W | 186.9 | 190.3 | W | 194.1 | 202.7 |
| 1996 | 186.3 | 190.9 | 183.4 | 177.6 | 174.8 | 166.7 | 180.1 | 184.5 | 167.7 | 190.5 | 188.5 | 184.3 |
| 1997 | W | W | 186.7 | 184.6 | W | W | W | W | W | W | 181.4 | 184.5 |
| 1998 | 166.5 | 171.9 | 173.5 | 173.8 | 177.1 | 192.6 | 205.8 | 206.3 | 197.4 | 201.9 | 200.5 | 203.8 |
| 1999 | 190.6 | 209.8 | 206.3 | W | 216.5 | 212.6 | 213.2 | 200.1 | 194.5 | 195.1 | 178.6 | 191.4 |
| 2000 | 150.6 | 156.8 | 149.7 | 144.0 | 141.0 | 118.0 | 130.2 | 134.4 | 122.6 | 121.6 | 124.2 | 134.7 |
| 2001 | 111.4 | 98.0 | 105.4 | 101.8 | 87.2 | 91.2 | 92.1 | 91.3 | 92.5 | 92.3 | 88.8 | 88.0 |
| 2002 | 86.1 | 94.1 | 96.5 | 103.3 | 107.0 | 108.4 | 113.0 | 105.7 | 97.0 | 102.2 | 113.7 | 108.2 |
| 2003 | 96.0 | 90.2 | 91.5 | 104.4 | 97.8 | 97.3 | 101.3 | 99.8 | 91.0 | 93.8 | 91.9 | 92.4 |
| 2004 | 75.5 | 73.4 | 81.8 | 82.9 | 66.4 | 71.6 | 72.9 | 69.2 | 67.9 | 61.5 | 64.0 | 69.1 |
| 2005 | 61.4 | 64.0 | 59.1 | 53.7 | 60.6 | 57.0 | 52.4 | 52.5 | 46.5 | 46.0 | 46.6 | 44.6 |
| 2006 | 40.0 | 42.5 | 45.1 | 40.2 | 41.0 | 41.6 | 38.2 | 39.3 | 38.5 | 38.4 | 40.5 | 41.6 |
| 2007 | 38.6 | 39.4 | 40.2 | 39.0 | 37.3 | 36.4 | 36.8 | 37.9 | 35.3 | 36.9 | 37.8 | 36.0 |
| 2008 | 32.5 | 34.7 | 32.3 | 32.2 | 30.2 | 31.0 | 29.7 | 27.3 | 27.4 | 28.5 | 30.1 | 31.9 |
| 2009 | 29.2 | 30.2 | 30.3 | 29.7 | 30.9 | 30.1 | 29.3 | 29.2 | 28.5 | 27.6 | 26.2 | 29.0 |
| 2010 | 24.8 | 26.5 | 26.3 | 26.6 | 29.2 | 27.7 | 36.6 | 28.8 | 24.7 | 24.9 | 24.5 | 23.7 |
| 2011 | 21.7 | 22.6 | 26.1 | 28.2 | 24.2 | 22.9 | 22.3 | 23.5 | 24.0 | 24.7 | 25.2 | 25.2 |
| 2012 | 23.8 | 24.0 | 21.1 | 18.9 | 21.4 | 22.3 | 21.5 | 23.6 | 25.0 | 30.2 | 30.9 | 28.3 |
| 2013 | 29.5 | 26.5 | 29.3 | 25.1 | 22.0 | 21.8 | 22.3 | 22.1 | 22.0 | 22.1 | 22.9 | 20.3 |
| 2014 | 20.7 | 21.3 | 20.4 | 19.9 | 19.6 | 18.8 | 18.9 | 19.0 | 18.4 | 18.0 | 22.1 | 21.5 |
| 2015 | 19.7 | 20.3 | 19.3 | 20.4 | 20.6 | 20.5 | 20.7 | 20.7 | 20.5 | 19.8 | 21.1 | 21.3 |
| 2016 | 19.3 | 20.2 | 20.1 | 20.9 | 21.0 | 21.1 | 20.7 | 21.3 | 19.6 | 18.3 | 17.9 | 18.4 |
| 2017 | 16.9 | 17.0 | 18.3 | 17.2 | 18.2 | 19.2 | 18.0 | 18.6 | 17.0 | 16.8 | 17.1 | 17.0 |
| 2018 | 16.0 | 16.8 | 19.3 | 17.7 | 19.7 | 18.3 | 15.9 | 16.8 | 15.8 | 16.0 | 16.4 | 15.0 |
| 2019 | 14.2 | 14.9 | 16.5 | 13.9 | 13.0 | 12.6 | 11.5 | 11.9 | 11.7 | 11.3 | 11.0 | 11.7 |
| 2020 | 10.4 | 10.6 | 9.4 | 9.7 | 11.9 | 15.6 | 15.3 | 15.1 | 15.0 | 14.3 | 14.0 | 14.4 |
| 2021 | 12.9 | 14.2 | 15.2 | 17.4 | 12.5 | 10.8 | 10.0 | 10.1 | 6.0 | 5.7 | 5.9 | 6.0 |
| 2022 | 12.8 | 13.2 | W | |||||||||
| - = No Data Reported; -- = Not Applicable; NA = Not Available; W = Withheld to avoid disclosure of individual company data. |
| Release Date: 5/19/2022 |
| Next Release Date: TBD |