|
Download Data (XLS File) |
|
||||||||
|
||||||||
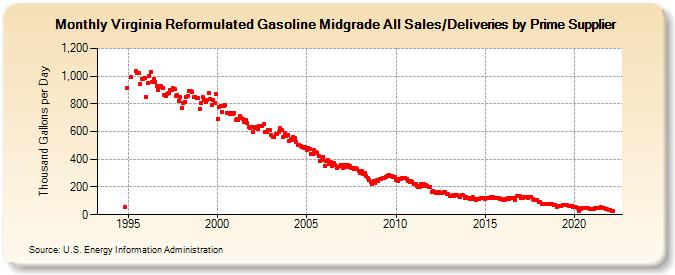
| Virginia Reformulated Gasoline Midgrade All Sales/Deliveries by Prime Supplier (Thousand Gallons per Day) | ||||||||
| Year | Jan | Feb | Mar | Apr | May | Jun | Jul | Aug | Sep | Oct | Nov | Dec |
|---|---|---|---|---|---|---|---|---|---|---|---|---|
| 1993 | - | - | - | |||||||||
| 1994 | - | - | - | - | - | - | - | - | - | - | 58.0 | 912.3 |
| 1995 | W | W | 991.3 | W | W | 1,040.1 | 1,019.3 | 1,020.8 | 942.5 | 977.9 | 979.2 | 987.7 |
| 1996 | 852.5 | 947.7 | 1,001.7 | 1,027.2 | 955.6 | 977.0 | 955.9 | 925.8 | 899.6 | 918.5 | 929.0 | 911.0 |
| 1997 | 862.8 | 859.6 | 868.9 | 878.9 | 902.6 | 896.2 | 915.3 | 909.2 | 857.5 | 865.8 | 822.7 | 846.1 |
| 1998 | 770.6 | 803.0 | 815.6 | 848.4 | 854.3 | 889.5 | 890.8 | 882.4 | 847.1 | 848.6 | 841.1 | 840.6 |
| 1999 | 765.0 | 807.7 | 846.6 | 826.8 | 811.3 | 829.4 | 877.4 | 833.5 | 789.7 | 826.9 | 806.7 | 869.0 |
| 2000 | 688.1 | 777.1 | 783.3 | 743.4 | 787.7 | 793.1 | 732.1 | 734.9 | 725.1 | 735.3 | 726.0 | 735.3 |
| 2001 | 684.0 | 693.3 | 685.7 | 712.4 | 698.9 | 691.9 | 670.5 | 684.3 | 663.4 | 634.1 | 623.2 | 630.9 |
| 2002 | 597.5 | 628.8 | 632.9 | 617.3 | 640.0 | 636.5 | 638.9 | 652.1 | 593.9 | 598.7 | 610.2 | 611.6 |
| 2003 | 573.6 | 559.1 | 561.8 | 579.3 | 580.6 | 596.9 | 622.1 | 611.1 | 560.5 | 588.0 | 566.7 | 573.9 |
| 2004 | 530.5 | 548.2 | 541.9 | 563.2 | 553.7 | 522.3 | 506.2 | 500.8 | 497.7 | 486.8 | 479.6 | 490.1 |
| 2005 | 465.8 | 483.9 | 473.3 | 439.2 | 440.6 | 465.0 | 450.6 | 447.7 | 424.8 | 389.7 | 392.6 | 415.2 |
| 2006 | 354.4 | 386.7 | 391.7 | 367.1 | 380.1 | 354.9 | 372.1 | 355.5 | 334.0 | 340.9 | 351.5 | 357.4 |
| 2007 | 337.7 | 359.5 | 360.5 | 347.3 | 357.8 | 348.9 | 337.9 | 339.0 | 331.5 | 333.8 | 328.2 | 317.7 |
| 2008 | 299.2 | 313.6 | 294.8 | 300.6 | 281.8 | 267.1 | 248.8 | 232.9 | 224.6 | 244.7 | 225.9 | 249.0 |
| 2009 | 241.3 | 256.0 | 257.6 | 267.6 | 266.7 | 273.6 | 282.1 | 288.5 | 277.1 | 276.0 | 270.6 | 274.8 |
| 2010 | 250.8 | 243.8 | 260.7 | 259.6 | 263.4 | 264.1 | 266.4 | 256.0 | 241.4 | 236.4 | 241.0 | 238.1 |
| 2011 | 221.5 | 219.9 | 206.7 | 197.2 | 196.5 | 222.8 | 210.6 | 220.1 | 215.9 | 207.4 | 199.9 | 196.4 |
| 2012 | 166.3 | 168.2 | 163.6 | 155.2 | 157.0 | 160.6 | 158.7 | 158.0 | 162.2 | 165.5 | 151.7 | 146.2 |
| 2013 | 138.5 | 137.3 | 139.8 | 132.9 | 139.5 | 140.8 | 135.3 | 126.7 | 142.3 | 139.5 | 122.4 | 124.9 |
| 2014 | 117.0 | 118.7 | 116.0 | 116.9 | 125.7 | 112.0 | 108.9 | 110.3 | 115.1 | 124.1 | 122.4 | 123.2 |
| 2015 | 111.0 | 117.1 | 117.5 | 120.3 | 130.0 | 130.5 | 122.9 | 122.4 | 121.1 | 118.5 | 114.6 | 113.0 |
| 2016 | 104.0 | 108.4 | 111.0 | 118.2 | 115.7 | 122.6 | 117.7 | 120.4 | 109.7 | 133.5 | 133.0 | 134.9 |
| 2017 | 119.5 | 123.6 | 126.9 | 125.0 | 130.9 | 120.8 | 124.8 | 124.7 | 114.7 | 104.7 | 105.0 | 108.3 |
| 2018 | 88.4 | 93.4 | 80.0 | 80.8 | 75.1 | 80.7 | 77.7 | 79.0 | 74.0 | 75.7 | 72.2 | 70.3 |
| 2019 | 58.2 | 60.1 | 61.2 | 63.1 | 69.1 | 68.8 | 67.0 | 67.6 | 62.6 | 63.3 | 63.3 | 57.9 |
| 2020 | 54.1 | 52.6 | 48.4 | 28.2 | 42.2 | 50.2 | 51.2 | 47.6 | 48.2 | 45.7 | 43.9 | 43.2 |
| 2021 | 40.0 | 39.4 | 45.2 | 46.5 | 49.7 | 46.6 | 53.5 | 47.3 | 46.6 | 40.1 | 38.8 | 35.4 |
| 2022 | 31.5 | 30.4 | 28.2 | |||||||||
| - = No Data Reported; -- = Not Applicable; NA = Not Available; W = Withheld to avoid disclosure of individual company data. |
| Release Date: 5/19/2022 |
| Next Release Date: TBD |