|
Download Data (XLS File) |
|
||||||||
|
||||||||
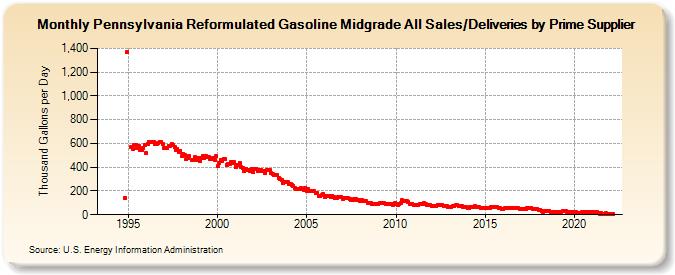
| Pennsylvania Reformulated Gasoline Midgrade All Sales/Deliveries by Prime Supplier (Thousand Gallons per Day) | ||||||||
| Year | Jan | Feb | Mar | Apr | May | Jun | Jul | Aug | Sep | Oct | Nov | Dec |
|---|---|---|---|---|---|---|---|---|---|---|---|---|
| 1993 | - | - | - | |||||||||
| 1994 | - | - | - | - | - | - | - | - | - | - | 141.5 | 1,369.7 |
| 1995 | W | W | 570.6 | 554.0 | 583.0 | 587.7 | 562.9 | 574.4 | 541.8 | 545.2 | 564.4 | 586.9 |
| 1996 | 516.1 | 594.7 | 613.3 | 615.3 | 608.2 | 609.9 | 594.1 | 594.1 | 601.4 | 615.7 | 614.6 | 597.0 |
| 1997 | 564.1 | 558.3 | 564.6 | 578.7 | 580.7 | 595.1 | 589.1 | 568.0 | 547.4 | 554.1 | 529.7 | 538.9 |
| 1998 | 493.7 | 511.1 | 503.9 | 466.5 | 475.1 | 492.3 | W | 459.6 | 459.0 | 483.9 | 463.5 | 474.9 |
| 1999 | 453.5 | 479.8 | 492.6 | 476.4 | 493.7 | 489.4 | 487.7 | 469.3 | 467.1 | 476.6 | 464.5 | 496.0 |
| 2000 | 407.2 | 435.8 | 457.6 | 452.5 | 469.8 | 465.9 | 419.4 | 425.4 | 425.8 | 442.5 | 435.2 | 441.4 |
| 2001 | 402.1 | 414.8 | 422.4 | 431.2 | 398.6 | 389.5 | 366.4 | 383.1 | 375.8 | 379.3 | 366.6 | 382.0 |
| 2002 | 359.8 | 381.3 | 384.9 | 367.1 | 373.0 | 378.4 | 365.0 | 368.6 | 355.2 | 375.4 | 377.3 | 373.9 |
| 2003 | 350.5 | 341.1 | 330.6 | 332.2 | 335.0 | 307.1 | 296.9 | 289.6 | 264.9 | 277.8 | 274.3 | 276.2 |
| 2004 | 262.3 | 258.4 | 250.3 | 245.0 | 223.3 | 215.3 | 218.9 | 215.6 | 222.2 | 220.5 | 212.1 | 227.7 |
| 2005 | 202.8 | 212.5 | 202.0 | 197.1 | 195.5 | 197.2 | 182.1 | 179.1 | 160.4 | 158.0 | 164.5 | 174.8 |
| 2006 | 151.0 | 160.8 | 156.8 | 156.8 | 147.5 | 160.2 | 152.8 | 140.0 | 140.9 | 145.0 | 145.8 | 150.9 |
| 2007 | 132.8 | 140.6 | 138.1 | 136.6 | 137.1 | 130.8 | 123.1 | 124.0 | 128.6 | 132.6 | 127.2 | 124.0 |
| 2008 | 118.1 | 121.6 | 118.6 | 118.0 | 111.4 | 99.2 | 94.6 | 95.5 | 93.2 | 92.7 | 90.6 | 94.2 |
| 2009 | 92.1 | 95.9 | 94.7 | 97.5 | 97.7 | 93.3 | 91.6 | 90.7 | 90.5 | 91.6 | 85.3 | 95.4 |
| 2010 | 89.1 | 85.8 | 89.8 | 94.8 | 121.4 | 118.5 | 114.4 | 114.1 | 106.3 | 93.5 | 91.9 | 92.8 |
| 2011 | 81.0 | 83.0 | 83.5 | 82.3 | 90.4 | 94.1 | 93.8 | 95.6 | 87.0 | 82.4 | 81.0 | 80.3 |
| 2012 | 70.6 | 74.4 | 76.2 | 74.3 | 82.2 | 82.2 | 79.2 | 80.1 | 74.9 | 74.0 | 71.3 | 66.5 |
| 2013 | 63.0 | 66.6 | 71.2 | 70.7 | 79.5 | 78.9 | 74.9 | 72.4 | 70.1 | 65.1 | 63.7 | 62.6 |
| 2014 | 57.1 | 59.5 | 60.8 | 63.7 | 67.1 | 69.6 | 67.1 | 65.3 | 63.1 | 60.2 | 58.9 | 57.6 |
| 2015 | 52.6 | 59.6 | 56.4 | 57.9 | 65.4 | 66.5 | 68.7 | 62.9 | 61.3 | 59.8 | 54.3 | 52.1 |
| 2016 | 48.9 | 52.8 | 54.2 | 54.7 | 58.3 | 60.6 | 57.4 | 55.9 | 55.8 | 53.0 | 54.0 | 51.0 |
| 2017 | 45.2 | 47.1 | 49.0 | 50.6 | 55.9 | 58.7 | 58.4 | 59.5 | 49.4 | 47.9 | 46.3 | 46.6 |
| 2018 | 42.4 | 42.3 | 27.7 | 26.8 | 30.0 | 29.0 | 29.9 | 30.5 | 24.6 | 26.8 | 25.3 | 23.9 |
| 2019 | 22.7 | 23.3 | 24.1 | 25.1 | 30.7 | 29.1 | 29.3 | 25.8 | 24.0 | 25.5 | 22.9 | 22.4 |
| 2020 | 20.8 | 22.4 | 18.5 | 14.8 | 17.5 | 20.5 | 26.5 | 24.7 | 25.0 | 23.1 | 19.2 | 19.4 |
| 2021 | 19.3 | 18.5 | 20.9 | 19.4 | 16.4 | 9.6 | 10.7 | 9.4 | 10.2 | 10.6 | 8.8 | 8.3 |
| 2022 | 6.4 | 7.0 | 6.6 | |||||||||
| - = No Data Reported; -- = Not Applicable; NA = Not Available; W = Withheld to avoid disclosure of individual company data. |
| Release Date: 5/19/2022 |
| Next Release Date: TBD |