|
Download Data (XLS File) |
|
||||||||
|
||||||||
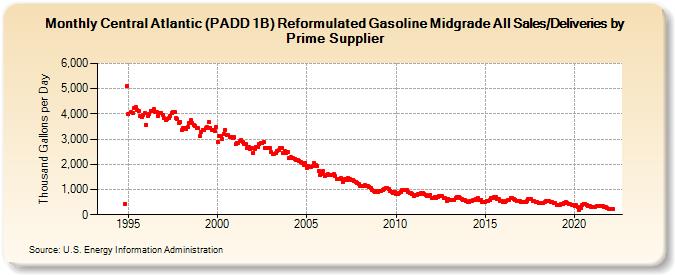
| Central Atlantic (PADD 1B) Reformulated Gasoline Midgrade All Sales/Deliveries by Prime Supplier (Thousand Gallons per Day) | ||||||||
| Year | Jan | Feb | Mar | Apr | May | Jun | Jul | Aug | Sep | Oct | Nov | Dec |
|---|---|---|---|---|---|---|---|---|---|---|---|---|
| 1993 | - | - | - | |||||||||
| 1994 | - | - | - | - | - | - | - | - | - | - | 437.2 | 5,096.3 |
| 1995 | 3,977.8 | W | 4,065.0 | 4,025.5 | 4,217.8 | 4,281.5 | 4,163.2 | 4,120.3 | 3,903.5 | 3,872.7 | 3,968.2 | 4,033.8 |
| 1996 | 3,569.3 | 3,922.6 | 3,976.7 | 4,130.3 | 4,134.0 | 4,176.8 | 4,078.3 | 4,073.6 | 3,912.6 | 4,034.1 | 4,046.0 | 3,963.4 |
| 1997 | 3,831.1 | 3,775.0 | 3,787.0 | 3,819.8 | 3,903.6 | 4,051.4 | 4,085.3 | 4,089.8 | 3,829.2 | 3,786.5 | 3,637.9 | 3,682.4 |
| 1998 | 3,351.3 | 3,453.4 | 3,425.7 | 3,416.0 | 3,492.6 | 3,644.7 | 3,738.9 | 3,624.1 | 3,543.4 | 3,532.5 | 3,425.3 | 3,420.7 |
| 1999 | 3,114.9 | 3,289.1 | 3,365.6 | 3,374.8 | 3,432.5 | 3,496.9 | 3,676.5 | 3,451.0 | 3,358.6 | 3,369.7 | 3,320.8 | 3,488.4 |
| 2000 | 2,888.4 | 3,122.6 | 3,117.2 | 2,997.1 | 3,210.2 | 3,373.0 | 3,146.8 | 3,145.6 | 3,095.8 | 3,070.8 | 3,035.7 | 3,069.2 |
| 2001 | 2,793.6 | 2,851.6 | 2,847.3 | 2,927.1 | 2,958.9 | 2,892.2 | 2,798.9 | 2,811.8 | 2,654.2 | 2,668.4 | 2,599.4 | 2,629.0 |
| 2002 | 2,459.3 | 2,622.7 | 2,674.5 | 2,682.0 | 2,788.0 | 2,849.2 | 2,844.0 | 2,887.8 | 2,637.5 | 2,656.4 | 2,663.8 | 2,627.7 |
| 2003 | 2,471.5 | 2,411.8 | 2,424.9 | 2,429.2 | 2,510.3 | 2,555.6 | 2,660.9 | 2,630.0 | 2,436.5 | 2,524.1 | 2,437.7 | 2,481.9 |
| 2004 | 2,241.9 | 2,277.3 | 2,268.8 | 2,230.6 | 2,210.9 | 2,151.2 | 2,153.9 | 2,139.6 | 2,073.6 | 2,054.8 | 1,991.8 | 2,052.2 |
| 2005 | 1,853.2 | 1,932.0 | 1,910.1 | 1,905.3 | 1,920.4 | 2,048.3 | 1,987.2 | 1,927.2 | 1,748.6 | 1,575.7 | 1,610.9 | 1,716.2 |
| 2006 | 1,519.0 | 1,555.8 | 1,596.3 | 1,573.1 | 1,560.4 | 1,580.3 | 1,608.0 | 1,551.8 | 1,415.4 | 1,417.1 | 1,413.7 | 1,445.7 |
| 2007 | 1,314.8 | 1,395.3 | 1,399.1 | 1,369.7 | 1,449.1 | 1,409.7 | 1,387.8 | 1,381.1 | 1,326.9 | 1,305.9 | 1,271.2 | 1,228.5 |
| 2008 | 1,148.3 | 1,155.9 | 1,158.1 | 1,178.7 | 1,145.7 | 1,136.2 | 1,101.9 | 1,056.7 | 983.8 | 960.6 | 916.5 | 933.0 |
| 2009 | 908.9 | 946.0 | 944.5 | 990.2 | 1,033.7 | 1,041.5 | 1,050.5 | 1,016.9 | 957.1 | 910.5 | 876.2 | 910.4 |
| 2010 | 840.1 | 804.2 | 871.8 | 909.5 | 961.7 | 984.2 | 1,000.3 | 981.6 | 898.4 | 867.1 | 842.4 | 836.3 |
| 2011 | 758.4 | 785.3 | 780.5 | 804.1 | 804.9 | 854.5 | 869.1 | 825.5 | 773.9 | 758.4 | 756.8 | 800.2 |
| 2012 | 656.3 | 680.4 | 695.8 | 676.8 | 696.4 | 725.5 | 743.5 | 739.1 | 672.2 | 651.3 | 535.6 | 613.7 |
| 2013 | 599.6 | 586.6 | 590.3 | 598.6 | 658.9 | 688.0 | 703.3 | 682.2 | 636.2 | 587.0 | 564.6 | 534.8 |
| 2014 | 499.2 | 510.4 | 530.7 | 548.3 | 587.1 | 601.3 | 639.2 | 643.5 | 585.6 | 576.1 | 520.2 | 509.8 |
| 2015 | 491.5 | 549.0 | 547.5 | 571.0 | 648.9 | 653.7 | 698.9 | 690.1 | 637.1 | 611.7 | 560.8 | 552.4 |
| 2016 | 519.4 | 520.8 | 558.2 | 576.8 | 600.1 | 655.0 | 659.8 | 643.0 | 601.2 | 549.8 | 544.4 | 537.0 |
| 2017 | 487.5 | 493.3 | 515.0 | 519.1 | 553.0 | 623.6 | 608.6 | 615.9 | 542.4 | 524.8 | 499.7 | 498.4 |
| 2018 | 452.4 | 457.8 | 447.9 | 458.2 | 493.5 | 526.6 | 527.6 | 540.5 | 498.3 | 488.9 | 479.0 | 459.5 |
| 2019 | 366.1 | 374.4 | 383.4 | 421.4 | 433.5 | 453.1 | 497.3 | 478.3 | 427.9 | 410.4 | 399.3 | 380.3 |
| 2020 | 357.0 | 368.4 | 298.4 | 189.5 | 273.0 | 385.2 | 441.9 | 422.0 | 400.6 | 363.5 | 335.5 | 316.5 |
| 2021 | 303.2 | 289.6 | 324.0 | 340.4 | 339.6 | 329.5 | 350.9 | 334.3 | 315.1 | 287.1 | 265.9 | 246.2 |
| 2022 | 217.4 | 244.0 | 235.4 | |||||||||
| - = No Data Reported; -- = Not Applicable; NA = Not Available; W = Withheld to avoid disclosure of individual company data. |
| Release Date: 5/19/2022 |
| Next Release Date: TBD |