|
Download Data (XLS File) |
|
||||||||
|
||||||||
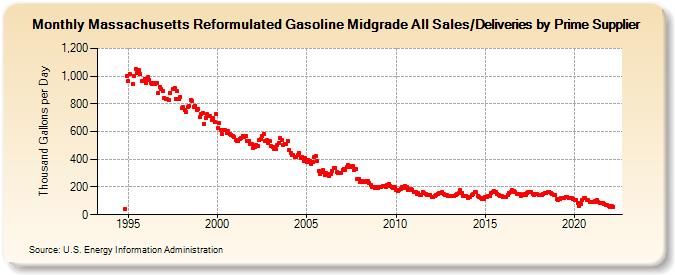
| Massachusetts Reformulated Gasoline Midgrade All Sales/Deliveries by Prime Supplier (Thousand Gallons per Day) | ||||||||
| Year | Jan | Feb | Mar | Apr | May | Jun | Jul | Aug | Sep | Oct | Nov | Dec |
|---|---|---|---|---|---|---|---|---|---|---|---|---|
| 1993 | - | - | - | |||||||||
| 1994 | - | - | - | - | - | - | - | - | - | - | 39.4 | 1,002.1 |
| 1995 | 963.8 | 1,015.9 | W | 941.9 | 1,003.9 | 1,048.7 | 1,022.4 | 1,043.0 | 1,012.8 | 964.8 | 966.3 | 980.8 |
| 1996 | 951.8 | 994.0 | 974.9 | 950.2 | 944.3 | 952.1 | 942.5 | 948.6 | 876.6 | 924.1 | 905.4 | 890.5 |
| 1997 | 844.1 | 836.0 | 831.5 | 824.2 | 879.7 | W | 907.4 | 912.7 | 837.2 | 890.2 | 834.6 | 850.0 |
| 1998 | 767.6 | 774.6 | 756.9 | 742.7 | 774.6 | 785.0 | 826.2 | 821.5 | 778.4 | 787.9 | 757.5 | 762.4 |
| 1999 | 702.1 | 727.4 | 733.6 | 652.9 | 696.9 | 723.9 | 713.3 | 710.9 | 683.8 | 694.9 | 670.9 | 729.8 |
| 2000 | 622.7 | 663.1 | 611.8 | 579.6 | 610.6 | 611.0 | 586.7 | 601.7 | 580.9 | 573.9 | 566.6 | 561.2 |
| 2001 | 539.8 | 529.1 | 529.1 | 546.3 | 555.8 | 566.9 | 557.2 | 570.9 | 534.1 | 530.6 | 510.8 | 509.0 |
| 2002 | 478.4 | 491.2 | 502.4 | 492.6 | 537.8 | 542.7 | 566.4 | 585.2 | 533.6 | 536.2 | 520.1 | 530.2 |
| 2003 | 493.2 | 490.0 | 472.6 | 473.9 | 500.7 | 519.5 | 551.3 | 535.9 | 501.1 | 513.3 | 510.0 | 534.8 |
| 2004 | 465.6 | 447.7 | 434.3 | 430.3 | 412.9 | 413.4 | 430.0 | 446.0 | 408.6 | 415.9 | 387.2 | 408.6 |
| 2005 | 382.2 | 397.1 | 388.8 | 367.4 | 378.7 | 419.2 | 424.8 | 385.5 | 318.2 | 290.8 | 304.8 | 321.3 |
| 2006 | 289.5 | 299.0 | 294.3 | 279.4 | 291.6 | 317.7 | 333.5 | 340.2 | 306.2 | 303.6 | 303.6 | 301.5 |
| 2007 | 324.9 | 331.5 | 323.2 | 340.9 | 355.8 | 345.8 | 351.7 | 350.0 | 325.2 | 331.1 | 259.7 | 258.9 |
| 2008 | 237.5 | 241.2 | 238.9 | 235.0 | 241.8 | 241.9 | 231.2 | 217.1 | 201.3 | 199.6 | 194.1 | 202.8 |
| 2009 | 193.2 | 202.0 | 198.3 | 206.7 | 208.7 | 203.4 | 212.1 | 224.8 | 208.3 | 197.3 | 192.0 | 203.1 |
| 2010 | 178.5 | 173.5 | 178.8 | 185.8 | 198.3 | 195.1 | 209.0 | 202.4 | 176.6 | 182.1 | 183.8 | 180.7 |
| 2011 | 163.7 | 161.2 | 148.7 | 154.0 | 142.9 | 145.6 | 162.2 | 154.3 | 152.3 | 145.4 | 144.7 | 143.1 |
| 2012 | 128.3 | 130.4 | 136.2 | 144.3 | 152.7 | 154.9 | 158.3 | 165.3 | 147.6 | 143.7 | 139.3 | 137.1 |
| 2013 | 133.1 | 133.6 | 133.4 | 134.8 | 143.6 | 151.0 | 155.0 | 176.8 | 157.8 | 133.0 | 133.8 | 132.5 |
| 2014 | 121.4 | 125.1 | 130.8 | 142.6 | 151.4 | 161.0 | 161.4 | 138.3 | 126.7 | 121.5 | 116.1 | 114.4 |
| 2015 | 126.5 | 130.6 | 133.8 | 137.2 | 155.7 | 163.1 | 171.0 | 162.6 | 149.8 | 143.4 | 137.7 | 134.8 |
| 2016 | 127.4 | 127.6 | 131.1 | 142.2 | 157.7 | 163.9 | 176.5 | 174.0 | 160.9 | 151.8 | 151.9 | 149.6 |
| 2017 | 137.8 | 139.2 | 146.3 | 143.2 | 156.7 | 163.6 | 166.6 | 161.1 | 148.5 | 145.5 | 147.7 | 148.1 |
| 2018 | 140.8 | 142.2 | 143.8 | 149.3 | 156.7 | 159.9 | 165.5 | 165.8 | 156.7 | 150.1 | 144.8 | 142.6 |
| 2019 | 110.7 | 109.2 | 113.2 | 118.4 | 122.0 | 123.4 | 131.1 | 130.2 | 121.2 | 118.3 | 117.8 | 113.9 |
| 2020 | 107.8 | 106.6 | 87.0 | 59.4 | 77.5 | 106.6 | 117.1 | 119.5 | 108.0 | 103.3 | 94.0 | 95.2 |
| 2021 | 88.5 | 93.4 | 98.2 | 102.8 | 92.3 | 86.4 | 87.8 | 83.1 | 79.4 | 72.9 | 68.5 | 65.8 |
| 2022 | 58.3 | 61.3 | 55.9 | |||||||||
| - = No Data Reported; -- = Not Applicable; NA = Not Available; W = Withheld to avoid disclosure of individual company data. |
| Release Date: 5/19/2022 |
| Next Release Date: TBD |