|
Download Data (XLS File) |
|
||||||||
|
||||||||
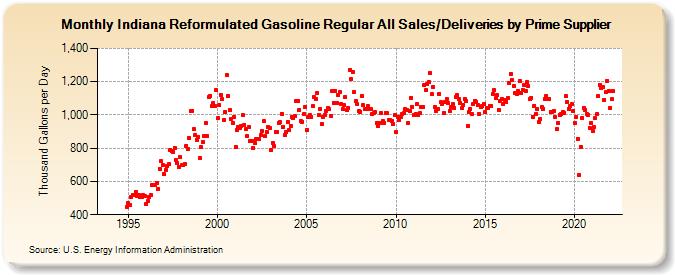
| Indiana Reformulated Gasoline Regular All Sales/Deliveries by Prime Supplier (Thousand Gallons per Day) | ||||||||
| Year | Jan | Feb | Mar | Apr | May | Jun | Jul | Aug | Sep | Oct | Nov | Dec |
|---|---|---|---|---|---|---|---|---|---|---|---|---|
| 1993 | - | - | - | |||||||||
| 1994 | - | - | - | - | - | - | - | - | - | - | W | 449.1 |
| 1995 | 468.7 | 461.0 | 505.6 | 521.0 | 516.8 | 537.3 | 513.5 | 516.4 | 507.6 | 508.8 | 517.3 | 510.8 |
| 1996 | 462.5 | 482.0 | 508.9 | 516.5 | 579.6 | 580.5 | 579.7 | 591.8 | 557.0 | 677.5 | 720.8 | 701.4 |
| 1997 | 644.0 | 670.8 | 695.1 | 705.1 | 791.8 | 784.1 | 778.7 | 799.8 | 728.7 | 710.0 | 689.8 | 745.3 |
| 1998 | 696.8 | 698.2 | 703.8 | 814.2 | 793.6 | 860.9 | 1,024.3 | 1,026.4 | 912.7 | 880.5 | 851.8 | 868.5 |
| 1999 | 740.7 | 804.4 | 837.4 | 871.5 | 952.7 | 874.1 | 1,108.6 | 1,114.3 | 1,051.9 | 1,071.6 | 1,056.1 | 1,150.0 |
| 2000 | 979.6 | 1,060.4 | 1,120.2 | 1,094.2 | 970.9 | 1,017.0 | 1,240.9 | 1,114.3 | 1,029.3 | 976.9 | 952.8 | 987.3 |
| 2001 | 809.2 | 911.3 | 927.0 | 923.3 | 932.7 | 998.3 | 940.4 | 917.3 | 874.7 | 927.8 | 845.3 | 842.1 |
| 2002 | 803.0 | 828.4 | 852.6 | 854.4 | 855.7 | 881.3 | 903.9 | 963.4 | 871.1 | 899.8 | 930.2 | 919.8 |
| 2003 | 788.6 | 833.3 | 812.2 | 896.1 | 896.3 | 950.4 | 955.9 | 1,008.4 | 929.1 | 877.8 | 898.2 | 956.6 |
| 2004 | 906.7 | 935.0 | 986.2 | 979.6 | 990.7 | 1,080.8 | 1,083.9 | 1,031.5 | 964.4 | 959.6 | 1,004.7 | 1,049.7 |
| 2005 | 912.0 | 990.0 | 997.4 | 989.8 | 1,055.2 | 1,105.7 | 1,097.6 | 1,132.1 | 1,002.3 | 1,036.1 | 944.4 | 988.7 |
| 2006 | 1,001.7 | 1,026.4 | 1,041.8 | 1,032.7 | 995.0 | 1,141.4 | 1,073.6 | 1,143.5 | 1,070.9 | 1,120.1 | 1,136.5 | 1,067.9 |
| 2007 | 1,034.3 | 1,057.7 | 1,107.8 | 1,027.5 | 1,042.4 | 1,271.9 | 1,214.4 | 1,257.7 | 1,135.4 | 1,081.6 | 1,062.8 | 1,024.6 |
| 2008 | 1,019.5 | 1,116.2 | 1,057.2 | 1,034.8 | 1,038.2 | 1,053.2 | 1,037.2 | 1,034.4 | 1,003.3 | 1,009.7 | 1,015.2 | 951.7 |
| 2009 | 932.4 | 953.4 | 1,011.5 | 962.7 | 953.7 | 1,012.3 | 1,009.5 | 970.0 | 969.0 | 964.3 | 944.1 | 997.3 |
| 2010 | 897.5 | 985.2 | 971.5 | 990.2 | 1,003.6 | 1,008.7 | 1,034.1 | 1,031.1 | 954.1 | 1,026.0 | 1,103.5 | 1,047.7 |
| 2011 | 1,001.6 | 1,006.3 | 1,064.0 | 999.3 | 1,010.0 | 1,047.4 | 1,049.9 | 1,177.5 | 1,149.3 | 1,188.2 | 1,199.0 | 1,252.4 |
| 2012 | 1,125.7 | 1,170.0 | 1,050.4 | 1,024.9 | 1,035.6 | 1,126.4 | 1,074.9 | 1,065.6 | 1,013.5 | 1,077.6 | 1,097.9 | 1,072.5 |
| 2013 | 1,022.7 | 1,045.3 | 1,065.3 | 1,040.5 | 1,106.7 | 1,117.5 | 1,097.6 | 1,073.8 | 1,039.6 | 1,061.5 | 1,096.7 | 1,083.3 |
| 2014 | 935.3 | 1,015.0 | 1,033.3 | 1,006.3 | 1,065.2 | 1,085.7 | 1,080.4 | 1,056.8 | 1,004.9 | 1,044.8 | 1,050.7 | 1,068.5 |
| 2015 | 1,016.4 | 1,042.7 | 1,039.6 | 1,056.3 | 1,052.9 | 1,128.7 | 1,147.4 | 1,099.6 | 1,116.8 | 1,031.8 | 1,085.8 | 1,095.8 |
| 2016 | 1,062.9 | 1,087.2 | 1,080.5 | 1,099.8 | 1,189.8 | 1,247.6 | 1,210.5 | 1,175.0 | 1,131.2 | 1,126.8 | 1,144.4 | 1,206.3 |
| 2017 | 1,129.7 | 1,151.6 | 1,182.5 | 1,144.6 | 1,195.8 | 1,175.2 | 1,095.1 | 1,104.2 | 989.6 | 1,055.3 | 1,008.0 | 1,032.7 |
| 2018 | 956.3 | 977.9 | 1,047.0 | 1,037.2 | 1,093.6 | 1,116.6 | 1,092.8 | 1,098.4 | 1,016.3 | 1,015.1 | 1,022.7 | 987.1 |
| 2019 | 913.8 | 952.5 | 1,002.0 | 1,003.5 | 1,015.5 | 1,014.2 | 1,113.5 | 1,079.0 | 1,036.2 | 1,051.3 | 1,062.7 | 1,024.5 |
| 2020 | 950.6 | 987.9 | 858.2 | 641.6 | 807.7 | 983.1 | 1,043.0 | 1,031.2 | 1,006.5 | 1,001.8 | 922.9 | 950.6 |
| 2021 | 903.6 | 926.0 | 979.6 | 1,003.8 | 1,113.5 | 1,181.8 | 1,163.9 | 1,167.4 | 1,092.0 | 1,135.4 | 1,206.5 | 1,143.8 |
| 2022 | 1,044.0 | 1,093.7 | 1,143.5 | |||||||||
| - = No Data Reported; -- = Not Applicable; NA = Not Available; W = Withheld to avoid disclosure of individual company data. |
| Release Date: 5/19/2022 |
| Next Release Date: TBD |