|
Download Data (XLS File) |
|
||||||||
|
||||||||
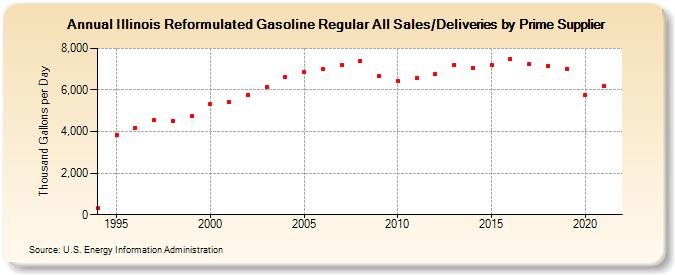
| Illinois Reformulated Gasoline Regular All Sales/Deliveries by Prime Supplier (Thousand Gallons per Day) | ||||||||
| Decade | Year-0 | Year-1 | Year-2 | Year-3 | Year-4 | Year-5 | Year-6 | Year-7 | Year-8 | Year-9 |
|---|---|---|---|---|---|---|---|---|---|---|
| 1990's | 306.1 | 3,830.9 | 4,192.8 | 4,562.5 | 4,520.8 | 4,730.8 | ||||
| 2000's | 5,335.6 | 5,430.6 | 5,749.4 | 6,136.2 | 6,606.4 | 6,851.2 | 6,993.9 | 7,223.3 | 7,412.9 | 6,687.8 |
| 2010's | 6,411.0 | 6,599.1 | 6,753.9 | 7,218.5 | 7,049.9 | 7,207.4 | 7,491.2 | 7,244.9 | 7,170.4 | 7,011.2 |
| 2020's | 5,757.8 |
| - = No Data Reported; -- = Not Applicable; NA = Not Available; W = Withheld to avoid disclosure of individual company data. |
| Release Date: 6/1/2022 |
| Next Release Date: TBD |