|
Download Data (XLS File) |
|
||||||||
|
||||||||
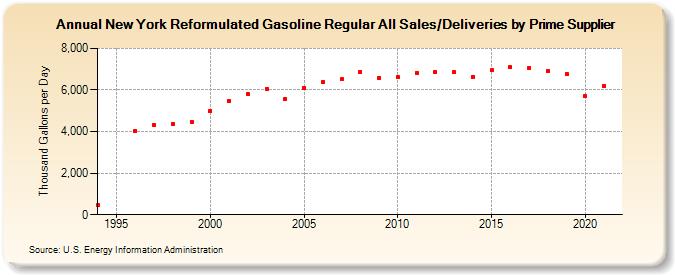
| New York Reformulated Gasoline Regular All Sales/Deliveries by Prime Supplier (Thousand Gallons per Day) | ||||||||
| Decade | Year-0 | Year-1 | Year-2 | Year-3 | Year-4 | Year-5 | Year-6 | Year-7 | Year-8 | Year-9 |
|---|---|---|---|---|---|---|---|---|---|---|
| 1990's | 457.7 | W | 4,035.1 | 4,320.1 | 4,370.7 | 4,475.2 | ||||
| 2000's | 4,994.9 | 5,475.0 | 5,808.5 | 6,066.8 | 5,573.8 | 6,105.7 | 6,359.6 | 6,513.4 | 6,866.5 | 6,582.2 |
| 2010's | 6,615.9 | 6,830.8 | 6,857.5 | 6,860.8 | 6,647.2 | 6,940.7 | 7,094.6 | 7,058.7 | 6,900.9 | 6,767.5 |
| 2020's | 5,698.1 |
| - = No Data Reported; -- = Not Applicable; NA = Not Available; W = Withheld to avoid disclosure of individual company data. |
| Release Date: 6/1/2022 |
| Next Release Date: TBD |