|
Download Data (XLS File) |
|
||||||||
|
||||||||
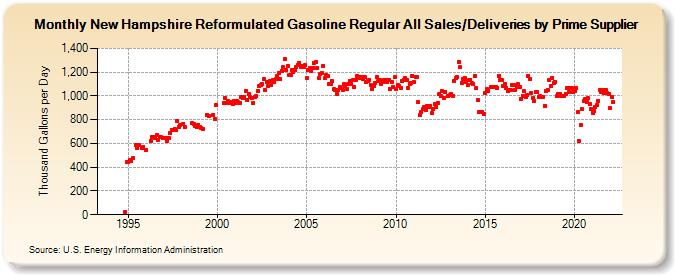
| New Hampshire Reformulated Gasoline Regular All Sales/Deliveries by Prime Supplier (Thousand Gallons per Day) | ||||||||
| Year | Jan | Feb | Mar | Apr | May | Jun | Jul | Aug | Sep | Oct | Nov | Dec |
|---|---|---|---|---|---|---|---|---|---|---|---|---|
| 1993 | - | - | - | |||||||||
| 1994 | - | - | - | - | - | - | - | - | - | - | 23.8 | 442.3 |
| 1995 | 446.6 | 458.3 | 455.8 | 475.5 | W | 583.2 | 562.8 | 586.4 | W | 562.6 | 573.6 | W |
| 1996 | 546.1 | W | W | 619.8 | 651.8 | 650.6 | 642.9 | 674.3 | 628.3 | 655.0 | 650.8 | 644.8 |
| 1997 | 643.9 | 646.2 | 621.9 | 647.4 | 690.6 | 717.2 | 715.5 | 721.5 | 716.6 | 789.0 | 737.3 | 758.5 |
| 1998 | W | 766.0 | 741.7 | W | W | W | W | 768.4 | 764.1 | 749.0 | 735.3 | 758.1 |
| 1999 | 736.3 | 729.1 | 722.7 | W | W | 843.4 | 829.2 | W | W | 842.3 | 804.5 | 927.3 |
| 2000 | W | W | W | W | 941.5 | 986.2 | 944.1 | 958.4 | 941.8 | 946.9 | 929.9 | 956.7 |
| 2001 | 939.1 | 960.3 | 945.0 | 940.6 | 994.6 | 979.5 | 989.8 | 1,043.8 | 961.8 | 1,016.2 | 989.6 | 985.7 |
| 2002 | 942.0 | 988.2 | 997.1 | 1,039.4 | 1,079.4 | 1,095.8 | 1,100.8 | 1,140.4 | 1,046.9 | 1,114.5 | 1,085.3 | 1,126.6 |
| 2003 | 1,091.3 | 1,137.5 | 1,118.2 | 1,141.1 | 1,171.8 | 1,196.1 | 1,139.4 | 1,207.7 | 1,239.5 | 1,313.6 | 1,215.9 | 1,252.7 |
| 2004 | 1,176.9 | 1,175.0 | 1,218.6 | 1,202.8 | 1,216.2 | 1,242.8 | 1,264.2 | 1,278.2 | 1,241.9 | 1,255.1 | 1,241.8 | 1,257.2 |
| 2005 | 1,153.5 | 1,216.3 | 1,234.0 | 1,213.4 | 1,230.9 | 1,278.2 | 1,281.6 | 1,235.3 | 1,153.1 | 1,187.3 | 1,192.1 | 1,254.5 |
| 2006 | 1,150.2 | 1,177.2 | 1,163.4 | 1,097.3 | 1,102.6 | 1,121.6 | 1,055.9 | 1,052.1 | 1,018.5 | 1,051.7 | 1,073.2 | 1,064.8 |
| 2007 | 1,050.6 | 1,096.4 | 1,081.0 | 1,059.9 | 1,097.0 | 1,126.3 | 1,100.1 | 1,131.2 | 1,077.0 | 1,137.4 | 1,171.0 | 1,157.5 |
| 2008 | 1,153.7 | 1,160.0 | 1,143.7 | 1,155.9 | 1,115.3 | 1,128.6 | 1,137.9 | 1,090.3 | 1,062.3 | 1,084.2 | 1,112.5 | 1,160.8 |
| 2009 | 1,128.8 | 1,130.5 | 1,103.3 | 1,119.3 | 1,137.6 | 1,136.0 | 1,117.3 | 1,135.4 | 1,059.5 | 1,118.7 | 1,076.2 | 1,156.9 |
| 2010 | 1,059.8 | 1,092.7 | 1,081.2 | 1,070.5 | 1,122.2 | 1,131.6 | 1,150.1 | 1,138.0 | 1,069.4 | 1,102.2 | 1,110.3 | 1,170.0 |
| 2011 | 1,117.8 | 1,162.9 | 1,160.0 | 946.8 | 839.1 | 861.1 | 887.0 | 903.9 | 880.7 | 918.3 | 903.2 | 919.0 |
| 2012 | 857.7 | 887.6 | 932.7 | 909.8 | 944.0 | 1,013.2 | 995.7 | 1,038.4 | 984.7 | 1,035.0 | W | 1,003.3 |
| 2013 | 1,006.6 | 1,012.2 | 998.4 | 1,123.6 | 1,153.7 | 1,162.0 | 1,287.2 | 1,240.5 | 1,112.4 | 1,145.9 | 1,153.2 | 1,119.3 |
| 2014 | 1,089.8 | 1,133.1 | 1,136.1 | 1,105.9 | 1,098.1 | 1,167.8 | 1,068.6 | 965.2 | 867.1 | 861.3 | 864.2 | 847.2 |
| 2015 | 1,026.2 | 1,055.0 | 1,041.8 | W | 1,077.3 | 1,077.7 | 1,071.9 | 1,077.1 | 1,069.6 | 1,171.8 | 1,132.4 | 1,136.9 |
| 2016 | 1,084.4 | 1,104.3 | 1,069.4 | 1,042.0 | 1,049.6 | 1,049.9 | 1,092.2 | 1,092.7 | 1,051.9 | 1,074.2 | 1,098.2 | 1,075.9 |
| 2017 | 977.5 | 1,001.6 | 1,038.4 | 991.1 | 1,010.2 | 1,170.9 | 1,139.8 | 1,024.5 | 979.9 | 956.6 | 1,031.8 | 1,033.9 |
| 2018 | 993.5 | 996.2 | 994.4 | 993.0 | 917.8 | 1,045.4 | 1,049.8 | 1,134.1 | 1,081.0 | 1,153.9 | 1,111.9 | 1,119.8 |
| 2019 | 999.5 | 1,016.9 | 1,013.6 | 999.2 | 995.5 | 1,003.0 | 1,019.0 | 1,065.7 | 1,031.8 | 1,064.4 | 1,064.5 | 1,036.5 |
| 2020 | 1,042.4 | 1,064.2 | 863.9 | 616.8 | 755.8 | 891.5 | 960.6 | 971.7 | 952.0 | 979.4 | 935.2 | 891.8 |
| 2021 | 859.5 | 872.3 | 909.9 | 926.8 | 959.7 | 1,050.5 | 1,029.0 | 1,051.7 | 1,024.7 | 1,049.2 | 1,023.3 | 1,014.7 |
| 2022 | 897.1 | 990.6 | 951.1 | |||||||||
| - = No Data Reported; -- = Not Applicable; NA = Not Available; W = Withheld to avoid disclosure of individual company data. |
| Release Date: 5/19/2022 |
| Next Release Date: TBD |