|
Download Data (XLS File) |
|
||||||||
|
||||||||
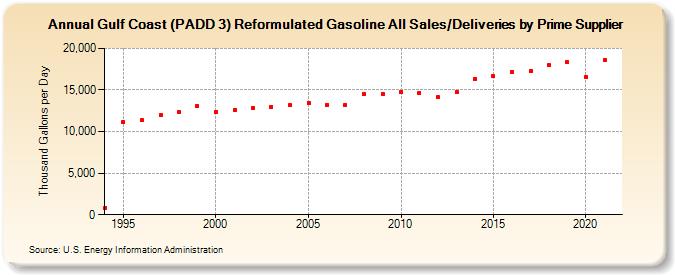
| Gulf Coast (PADD 3) Reformulated Gasoline All Sales/Deliveries by Prime Supplier (Thousand Gallons per Day) | ||||||||
| Decade | Year-0 | Year-1 | Year-2 | Year-3 | Year-4 | Year-5 | Year-6 | Year-7 | Year-8 | Year-9 |
|---|---|---|---|---|---|---|---|---|---|---|
| 1990's | 860.7 | 11,165.7 | 11,380.2 | 11,940.0 | 12,341.7 | 13,070.7 | ||||
| 2000's | 12,351.7 | 12,576.7 | 12,867.5 | 12,999.7 | 13,159.1 | 13,445.5 | 13,249.3 | 13,237.6 | 14,521.2 | 14,546.5 |
| 2010's | 14,788.4 | 14,644.9 | 14,154.5 | 14,757.2 | 16,379.2 | 16,625.3 | 17,156.0 | 17,324.7 | 17,950.5 | 18,361.3 |
| 2020's | 16,599.4 |
| - = No Data Reported; -- = Not Applicable; NA = Not Available; W = Withheld to avoid disclosure of individual company data. |
| Release Date: 6/1/2022 |
| Next Release Date: TBD |