|
Download Data (XLS File) |
|
||||||||
|
||||||||
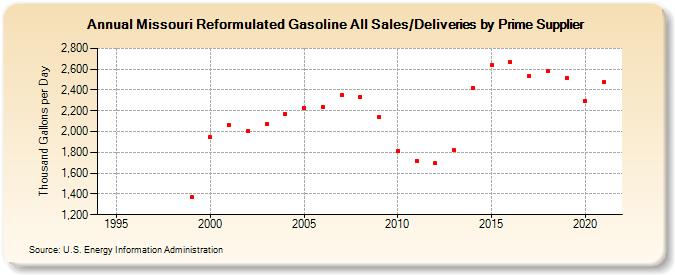
| Missouri Reformulated Gasoline All Sales/Deliveries by Prime Supplier (Thousand Gallons per Day) | ||||||||
| Decade | Year-0 | Year-1 | Year-2 | Year-3 | Year-4 | Year-5 | Year-6 | Year-7 | Year-8 | Year-9 |
|---|---|---|---|---|---|---|---|---|---|---|
| 1990's | - | - | - | - | - | 1,367.6 | ||||
| 2000's | 1,943.3 | 2,061.9 | 2,004.6 | 2,074.4 | 2,167.1 | 2,227.6 | 2,237.0 | 2,354.6 | 2,335.7 | 2,140.2 |
| 2010's | 1,810.9 | 1,719.7 | 1,693.7 | 1,819.4 | 2,420.9 | 2,642.4 | 2,669.7 | 2,532.1 | 2,580.4 | 2,519.3 |
| 2020's | 2,289.6 |
| - = No Data Reported; -- = Not Applicable; NA = Not Available; W = Withheld to avoid disclosure of individual company data. |
| Release Date: 6/1/2022 |
| Next Release Date: TBD |