|
Download Data (XLS File) |
|
||||||||
|
||||||||
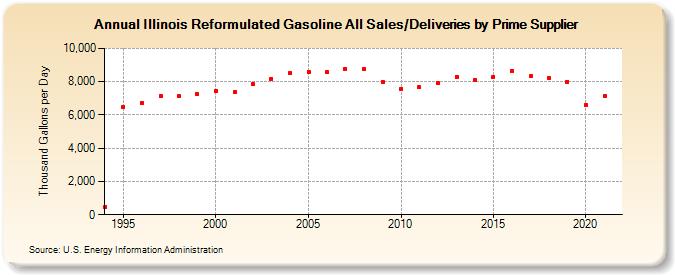
| Illinois Reformulated Gasoline All Sales/Deliveries by Prime Supplier (Thousand Gallons per Day) | ||||||||
| Decade | Year-0 | Year-1 | Year-2 | Year-3 | Year-4 | Year-5 | Year-6 | Year-7 | Year-8 | Year-9 |
|---|---|---|---|---|---|---|---|---|---|---|
| 1990's | 489.6 | 6,475.6 | 6,723.7 | 7,145.1 | 7,122.1 | 7,239.7 | ||||
| 2000's | 7,433.4 | 7,377.9 | 7,841.9 | 8,183.3 | 8,513.2 | 8,596.0 | 8,569.9 | 8,749.7 | 8,767.4 | 7,965.1 |
| 2010's | 7,567.3 | 7,655.3 | 7,917.9 | 8,296.4 | 8,105.7 | 8,306.9 | 8,640.6 | 8,318.8 | 8,198.1 | 7,995.3 |
| 2020's | 6,617.8 |
| - = No Data Reported; -- = Not Applicable; NA = Not Available; W = Withheld to avoid disclosure of individual company data. |
| Release Date: 6/1/2022 |
| Next Release Date: TBD |