|
Download Data (XLS File) |
|
||||||||
|
||||||||
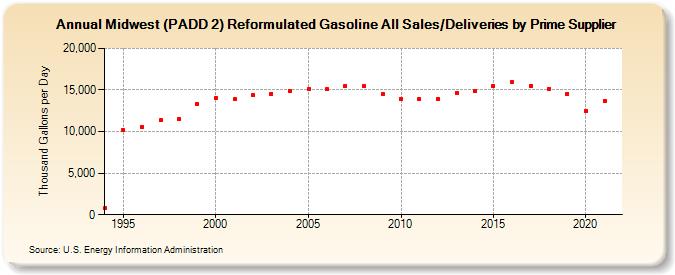
| Midwest (PADD 2) Reformulated Gasoline All Sales/Deliveries by Prime Supplier (Thousand Gallons per Day) | ||||||||
| Decade | Year-0 | Year-1 | Year-2 | Year-3 | Year-4 | Year-5 | Year-6 | Year-7 | Year-8 | Year-9 |
|---|---|---|---|---|---|---|---|---|---|---|
| 1990's | 766.9 | 10,169.5 | 10,592.9 | 11,351.8 | 11,556.8 | 13,334.6 | ||||
| 2000's | 14,073.0 | 13,882.5 | 14,388.9 | 14,568.1 | 14,897.3 | 15,114.4 | 15,082.5 | 15,468.3 | 15,437.1 | 14,533.5 |
| 2010's | 13,907.6 | 13,915.1 | 13,923.4 | 14,654.9 | 14,877.1 | 15,449.8 | 15,971.9 | 15,450.3 | 15,167.1 | 14,567.7 |
| 2020's | 12,518.5 |
| - = No Data Reported; -- = Not Applicable; NA = Not Available; W = Withheld to avoid disclosure of individual company data. |
| Release Date: 6/1/2022 |
| Next Release Date: TBD |