|
Download Data (XLS File) |
|
||||||||
|
||||||||
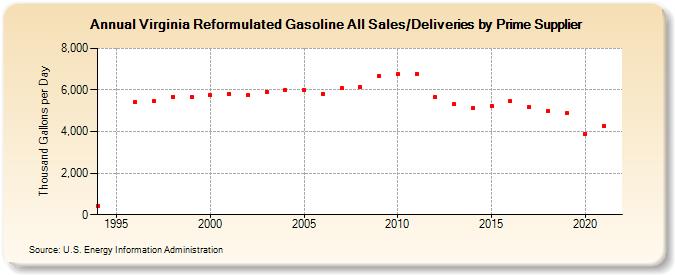
| Virginia Reformulated Gasoline All Sales/Deliveries by Prime Supplier (Thousand Gallons per Day) | ||||||||
| Decade | Year-0 | Year-1 | Year-2 | Year-3 | Year-4 | Year-5 | Year-6 | Year-7 | Year-8 | Year-9 |
|---|---|---|---|---|---|---|---|---|---|---|
| 1990's | 437.9 | W | 5,430.1 | 5,449.0 | 5,677.6 | 5,685.4 | ||||
| 2000's | 5,743.6 | 5,819.9 | 5,743.8 | 5,925.6 | 6,021.4 | 6,016.1 | 5,823.6 | 6,080.7 | 6,125.6 | 6,691.7 |
| 2010's | 6,746.1 | 6,783.5 | 5,648.1 | 5,321.6 | 5,131.1 | 5,247.9 | 5,447.4 | 5,179.9 | 4,994.5 | 4,873.2 |
| 2020's | 3,884.9 |
| - = No Data Reported; -- = Not Applicable; NA = Not Available; W = Withheld to avoid disclosure of individual company data. |
| Release Date: 6/1/2022 |
| Next Release Date: TBD |