|
Download Data (XLS File) |
|
||||||||
|
||||||||
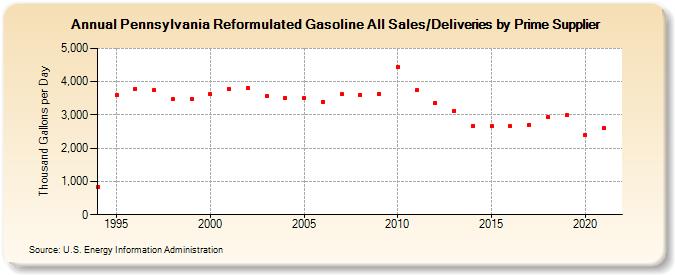
| Pennsylvania Reformulated Gasoline All Sales/Deliveries by Prime Supplier (Thousand Gallons per Day) | ||||||||
| Decade | Year-0 | Year-1 | Year-2 | Year-3 | Year-4 | Year-5 | Year-6 | Year-7 | Year-8 | Year-9 |
|---|---|---|---|---|---|---|---|---|---|---|
| 1990's | 826.6 | 3,584.8 | 3,790.8 | 3,746.1 | 3,476.1 | 3,472.8 | ||||
| 2000's | 3,617.4 | 3,774.8 | 3,795.9 | 3,565.9 | 3,515.4 | 3,510.0 | 3,396.1 | 3,619.0 | 3,600.9 | 3,634.2 |
| 2010's | 4,445.2 | 3,745.5 | 3,364.8 | 3,131.8 | 2,668.9 | 2,669.3 | 2,654.9 | 2,699.1 | 2,927.0 | 2,992.5 |
| 2020's | 2,407.8 |
| - = No Data Reported; -- = Not Applicable; NA = Not Available; W = Withheld to avoid disclosure of individual company data. |
| Release Date: 6/1/2022 |
| Next Release Date: TBD |