|
Download Data (XLS File) |
|
||||||||
|
||||||||
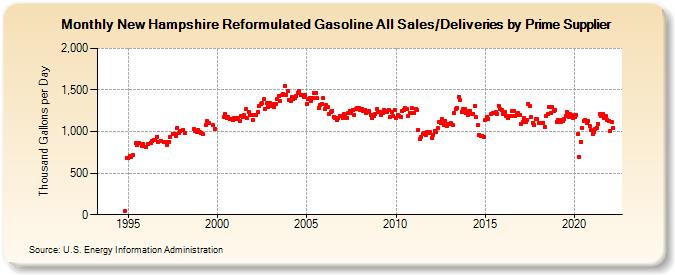
| New Hampshire Reformulated Gasoline All Sales/Deliveries by Prime Supplier (Thousand Gallons per Day) | ||||||||
| Year | Jan | Feb | Mar | Apr | May | Jun | Jul | Aug | Sep | Oct | Nov | Dec |
|---|---|---|---|---|---|---|---|---|---|---|---|---|
| 1993 | - | - | - | |||||||||
| 1994 | - | - | - | - | - | - | - | - | - | - | 41.8 | 683.2 |
| 1995 | 683.4 | 701.1 | 692.9 | 719.8 | W | 859.5 | 833.9 | 866.8 | W | 829.8 | 846.8 | W |
| 1996 | 808.7 | 847.9 | W | 866.9 | 888.4 | 896.3 | 894.4 | 940.4 | 870.9 | W | 889.1 | W |
| 1997 | 870.8 | 871.8 | 836.6 | 868.8 | 933.2 | W | 976.4 | 973.0 | 950.7 | 1,045.0 | 979.0 | 1,008.4 |
| 1998 | W | 1,021.3 | 986.6 | W | W | W | W | W | 1,034.2 | 1,011.7 | 994.6 | 1,022.6 |
| 1999 | 1,000.3 | 987.0 | 973.5 | W | 1,080.0 | 1,122.7 | 1,106.5 | W | W | 1,075.1 | 1,035.7 | W |
| 2000 | W | W | W | W | 1,171.4 | 1,212.9 | 1,158.5 | 1,179.7 | 1,153.0 | 1,156.6 | 1,133.5 | 1,165.5 |
| 2001 | 1,146.9 | 1,166.9 | 1,148.6 | 1,131.0 | 1,189.8 | 1,175.6 | 1,193.7 | 1,268.0 | 1,167.9 | 1,229.9 | 1,197.9 | 1,194.4 |
| 2002 | 1,136.8 | 1,198.9 | 1,195.4 | 1,235.1 | 1,301.5 | 1,327.2 | 1,342.4 | 1,388.0 | 1,275.5 | 1,339.8 | 1,296.8 | 1,347.7 |
| 2003 | 1,304.1 | 1,332.0 | 1,296.3 | 1,330.7 | 1,392.9 | 1,429.3 | 1,367.3 | 1,434.8 | 1,453.0 | 1,545.5 | 1,443.6 | 1,493.3 |
| 2004 | 1,384.5 | 1,372.4 | 1,410.0 | 1,389.4 | 1,401.9 | 1,430.2 | 1,466.8 | 1,490.0 | 1,440.2 | 1,438.3 | 1,418.2 | 1,445.0 |
| 2005 | 1,331.0 | 1,396.0 | 1,404.0 | 1,372.6 | 1,405.1 | 1,467.1 | 1,463.9 | 1,399.5 | 1,287.6 | 1,324.1 | 1,332.2 | 1,397.9 |
| 2006 | 1,274.0 | 1,314.9 | 1,294.6 | 1,216.3 | 1,229.5 | 1,252.2 | 1,180.8 | 1,168.9 | 1,134.2 | 1,168.7 | 1,190.0 | 1,182.1 |
| 2007 | 1,164.5 | 1,215.9 | 1,191.9 | 1,166.3 | 1,217.8 | 1,250.7 | 1,227.0 | 1,264.4 | 1,204.1 | 1,266.1 | 1,287.0 | 1,277.3 |
| 2008 | 1,263.0 | 1,272.2 | 1,247.6 | 1,261.2 | 1,221.5 | 1,235.0 | 1,246.3 | 1,204.7 | 1,159.8 | 1,183.2 | 1,212.7 | 1,270.4 |
| 2009 | 1,233.9 | 1,232.9 | 1,202.6 | 1,226.7 | 1,255.7 | 1,252.8 | 1,238.0 | 1,255.9 | 1,172.8 | 1,231.9 | 1,181.9 | 1,264.8 |
| 2010 | 1,158.9 | 1,197.4 | 1,186.1 | 1,179.7 | 1,247.1 | 1,259.0 | 1,279.9 | 1,268.4 | 1,189.3 | 1,222.1 | 1,222.2 | 1,278.4 |
| 2011 | 1,219.1 | 1,269.2 | 1,256.2 | 1,022.2 | 909.1 | 938.5 | 970.4 | 986.5 | 958.8 | 997.4 | 978.1 | 991.4 |
| 2012 | 924.3 | 957.6 | 1,008.5 | 990.1 | 1,037.4 | 1,118.5 | 1,100.5 | 1,148.6 | 1,078.8 | 1,131.7 | 1,061.8 | 1,090.5 |
| 2013 | 1,092.8 | 1,098.0 | 1,081.6 | 1,228.6 | 1,276.0 | 1,288.4 | 1,420.0 | 1,375.3 | 1,239.1 | 1,271.3 | 1,268.6 | 1,228.4 |
| 2014 | 1,193.9 | 1,244.0 | 1,244.1 | 1,216.3 | 1,214.5 | 1,304.7 | 1,172.9 | 1,073.4 | 962.0 | 952.0 | 951.1 | 931.2 |
| 2015 | 1,140.2 | 1,175.0 | 1,154.4 | W | 1,216.5 | 1,217.7 | 1,221.5 | 1,229.1 | 1,210.5 | 1,312.2 | 1,265.7 | 1,264.7 |
| 2016 | 1,207.4 | 1,230.1 | 1,192.0 | 1,164.5 | 1,188.4 | 1,192.1 | 1,244.5 | 1,243.6 | 1,185.1 | 1,201.5 | 1,222.0 | 1,193.7 |
| 2017 | 1,085.9 | 1,117.1 | 1,158.3 | 1,108.9 | 1,142.2 | 1,334.9 | 1,308.5 | 1,171.1 | 1,103.2 | 1,076.1 | 1,153.5 | 1,148.3 |
| 2018 | 1,108.1 | 1,107.7 | 1,104.4 | 1,104.8 | 1,049.1 | 1,188.0 | 1,207.6 | 1,298.6 | 1,225.0 | 1,296.2 | 1,244.3 | 1,257.8 |
| 2019 | 1,118.7 | 1,143.4 | 1,138.2 | 1,118.5 | 1,130.0 | 1,153.6 | 1,183.2 | 1,232.2 | 1,178.3 | 1,207.7 | 1,198.9 | 1,166.6 |
| 2020 | 1,172.5 | 1,201.6 | 970.3 | 697.3 | 877.4 | 1,040.2 | 1,121.5 | 1,140.5 | 1,107.2 | 1,128.1 | 1,067.3 | 1,012.8 |
| 2021 | 975.9 | 995.6 | 1,030.4 | 1,047.9 | 1,093.9 | 1,207.4 | 1,181.5 | 1,211.4 | 1,166.7 | 1,182.0 | 1,141.7 | 1,127.8 |
| 2022 | 1,005.0 | 1,110.7 | 1,044.4 | |||||||||
| - = No Data Reported; -- = Not Applicable; NA = Not Available; W = Withheld to avoid disclosure of individual company data. |
| Release Date: 5/19/2022 |
| Next Release Date: TBD |