|
Download Data (XLS File) |
|
||||||||
|
||||||||
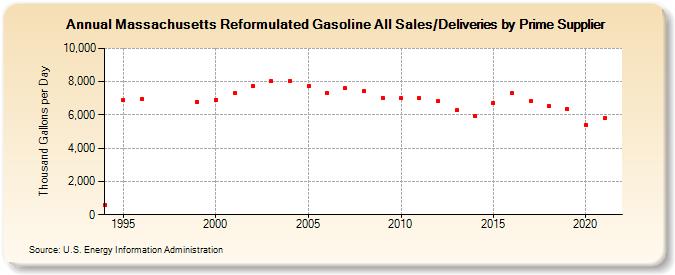
| Massachusetts Reformulated Gasoline All Sales/Deliveries by Prime Supplier (Thousand Gallons per Day) | ||||||||
| Decade | Year-0 | Year-1 | Year-2 | Year-3 | Year-4 | Year-5 | Year-6 | Year-7 | Year-8 | Year-9 |
|---|---|---|---|---|---|---|---|---|---|---|
| 1990's | 599.7 | 6,894.4 | 6,963.8 | W | W | 6,789.4 | ||||
| 2000's | 6,897.1 | 7,293.1 | 7,713.9 | 8,031.0 | 8,038.9 | 7,735.0 | 7,308.3 | 7,598.2 | 7,425.7 | 7,022.2 |
| 2010's | 6,997.2 | 6,993.4 | 6,821.3 | 6,276.4 | 5,934.6 | 6,708.5 | 7,291.4 | 6,815.7 | 6,521.1 | 6,342.2 |
| 2020's | 5,419.8 |
| - = No Data Reported; -- = Not Applicable; NA = Not Available; W = Withheld to avoid disclosure of individual company data. |
| Release Date: 6/1/2022 |
| Next Release Date: TBD |