|
Download Data (XLS File) |
|
||||||||
|
||||||||
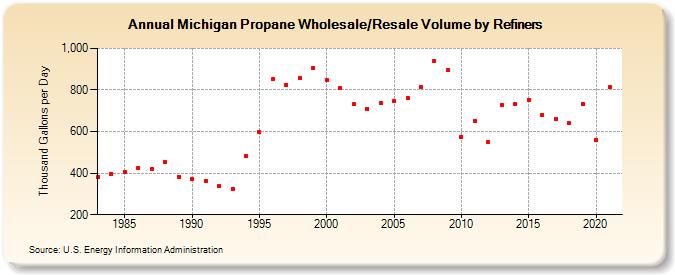
| Michigan Propane Wholesale/Resale Volume by Refiners (Thousand Gallons per Day) | ||||||||
| Decade | Year-0 | Year-1 | Year-2 | Year-3 | Year-4 | Year-5 | Year-6 | Year-7 | Year-8 | Year-9 |
|---|---|---|---|---|---|---|---|---|---|---|
| 1980's | 379.0 | 397.6 | 406.7 | 426.3 | 419.4 | 453.7 | 383.6 | |||
| 1990's | 370.0 | 363.8 | 337.2 | 325.1 | 481.8 | 598.1 | 850.9 | 826.1 | 859.3 | 906.0 |
| 2000's | 847.0 | 807.7 | 731.7 | 710.5 | 735.7 | 747.4 | 762.9 | 816.5 | 940.0 | 895.5 |
| 2010's | 576.0 | 652.5 | 549.2 | 726.5 | 732.8 | 752.0 | 680.9 | 661.8 | 642.3 | 732.8 |
| 2020's | 560.1 |
| - = No Data Reported; -- = Not Applicable; NA = Not Available; W = Withheld to avoid disclosure of individual company data. |
| Release Date: 6/1/2022 |
| Next Release Date: TBD |