|
Download Data (XLS File) |
|
||||||||
|
||||||||
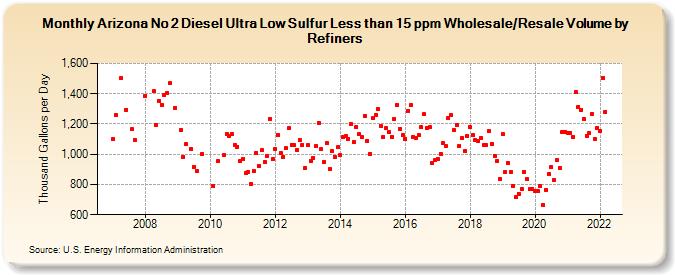
| Arizona No 2 Diesel Ultra Low Sulfur Less than 15 ppm Wholesale/Resale Volume by Refiners (Thousand Gallons per Day) | ||||||||
| Year | Jan | Feb | Mar | Apr | May | Jun | Jul | Aug | Sep | Oct | Nov | Dec |
|---|---|---|---|---|---|---|---|---|---|---|---|---|
| 2007 | 1,098.3 | 1,260.5 | W | 1,502.5 | W | 1,295.7 | W | 1,164.7 | 1,094.7 | W | W | W |
| 2008 | 1,386.9 | W | W | 1,415.6 | 1,193.0 | 1,352.6 | 1,328.7 | 1,393.8 | 1,401.9 | 1,467.8 | W | 1,308.9 |
| 2009 | W | 1,158.9 | 984.6 | 1,064.6 | W | 1,032.9 | 918.8 | 892.1 | W | 1,002.3 | W | W |
| 2010 | W | 790.8 | W | 953.9 | W | 992.0 | 1,130.7 | 1,122.3 | 1,132.4 | 1,061.1 | 1,049.8 | 952.5 |
| 2011 | 967.4 | 874.8 | 881.8 | 805.4 | 887.7 | 1,011.2 | 922.8 | 1,024.7 | 949.2 | 989.2 | 1,233.3 | 967.0 |
| 2012 | 1,035.3 | 1,127.5 | 1,009.6 | 982.6 | 1,038.7 | 1,171.7 | 1,064.0 | 1,059.7 | 1,030.5 | 1,093.7 | 1,063.6 | 911.1 |
| 2013 | 1,058.9 | 956.2 | 975.6 | 1,054.3 | 1,209.5 | 1,033.1 | 947.7 | 1,074.7 | 903.3 | 1,021.6 | 983.7 | 1,045.1 |
| 2014 | 995.9 | 1,115.4 | 1,120.3 | 1,103.3 | 1,200.4 | 1,080.0 | 1,180.2 | 1,130.8 | 1,110.6 | 1,255.6 | 1,087.8 | 1,004.6 |
| 2015 | 1,236.4 | 1,258.0 | 1,298.5 | 1,183.8 | 1,115.7 | 1,170.7 | 1,145.9 | 1,116.7 | 1,234.4 | 1,328.5 | 1,169.2 | 1,126.5 |
| 2016 | 1,100.4 | 1,286.7 | 1,322.6 | 1,115.4 | 1,109.1 | 1,124.0 | 1,177.0 | 1,263.5 | 1,171.3 | 1,178.1 | 941.2 | 961.4 |
| 2017 | 968.7 | 1,003.5 | 1,071.7 | 1,054.5 | 1,240.4 | 1,258.6 | 1,159.0 | 1,193.1 | 1,057.4 | 1,108.5 | 1,024.0 | 1,123.3 |
| 2018 | 1,177.7 | 1,128.4 | 1,092.9 | 1,086.1 | 1,110.3 | 1,062.2 | 1,060.9 | 1,155.1 | 1,069.8 | 990.0 | 953.7 | 836.6 |
| 2019 | 1,132.8 | 880.7 | 942.8 | 884.2 | 792.1 | 714.3 | 738.8 | 770.7 | 884.5 | 837.6 | 767.4 | 773.2 |
| 2020 | 754.7 | 756.2 | 791.3 | 664.6 | 765.6 | 871.8 | 914.9 | 830.0 | 964.5 | 908.7 | 1,145.0 | 1,149.1 |
| 2021 | 1,139.9 | 1,141.4 | 1,115.5 | 1,410.0 | 1,312.5 | 1,295.2 | 1,233.7 | 1,122.4 | 1,137.2 | 1,268.9 | 1,103.7 | 1,172.6 |
| 2022 | 1,155.2 | 1,506.5 | 1,281.5 | |||||||||
| - = No Data Reported; -- = Not Applicable; NA = Not Available; W = Withheld to avoid disclosure of individual company data. |
| Release Date: 6/1/2022 |
| Next Release Date: TBD |