|
Download Data (XLS File) |
|
||||||||
|
||||||||
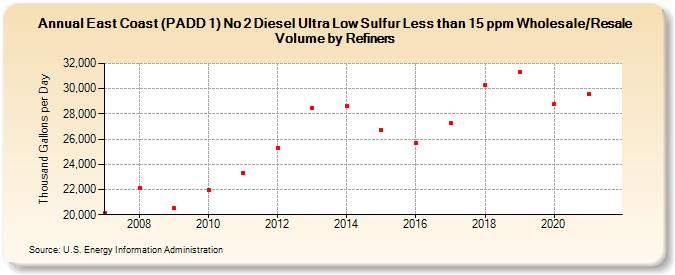
| East Coast (PADD 1) No 2 Diesel Ultra Low Sulfur Less than 15 ppm Wholesale/Resale Volume by Refiners (Thousand Gallons per Day) | ||||||||
| Decade | Year-0 | Year-1 | Year-2 | Year-3 | Year-4 | Year-5 | Year-6 | Year-7 | Year-8 | Year-9 |
|---|---|---|---|---|---|---|---|---|---|---|
| 2000's | 20,129.1 | 22,109.7 | 20,497.7 | |||||||
| 2010's | 21,923.3 | 23,347.9 | 25,312.7 | 28,456.0 | 28,640.9 | 26,695.4 | 25,719.6 | 27,277.6 | 30,276.5 | 31,289.2 |
| 2020's | 28,770.0 |
| - = No Data Reported; -- = Not Applicable; NA = Not Available; W = Withheld to avoid disclosure of individual company data. |
| Release Date: 6/1/2022 |
| Next Release Date: TBD |