|
Download Data (XLS File) |
|
||||||||
|
||||||||
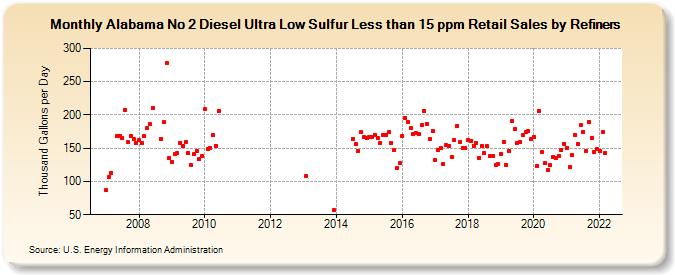
| Alabama No 2 Diesel Ultra Low Sulfur Less than 15 ppm Retail Sales by Refiners (Thousand Gallons per Day) | ||||||||
| Year | Jan | Feb | Mar | Apr | May | Jun | Jul | Aug | Sep | Oct | Nov | Dec |
|---|---|---|---|---|---|---|---|---|---|---|---|---|
| 2007 | 87.1 | 106.9 | 113.2 | W | 168.4 | 168.7 | 164.8 | 207.5 | 158.7 | 168.5 | 163.1 | 157.5 |
| 2008 | 161.6 | 157.1 | 168.4 | 179.9 | 185.8 | 211.1 | W | W | 163.9 | 188.9 | 277.8 | 134.8 |
| 2009 | 129.9 | 140.8 | 142.5 | 157.6 | 152.6 | 158.9 | 142.5 | 125.0 | 140.8 | 146.5 | 133.1 | 138.5 |
| 2010 | 208.8 | 148.1 | 150.7 | 170.0 | 153.5 | 206.2 | W | W | W | W | W | W |
| 2011 | W | W | W | W | W | W | W | W | W | W | W | W |
| 2012 | W | W | W | W | W | W | W | W | W | W | W | W |
| 2013 | W | 107.8 | W | W | W | W | W | W | W | W | W | 56.5 |
| 2014 | W | W | W | W | W | W | 163.5 | 156.1 | 145.5 | 173.6 | 166.2 | 165.9 |
| 2015 | 166.3 | 167.3 | 170.2 | 165.0 | 158.1 | 169.6 | 169.3 | 173.7 | 157.8 | 146.7 | 120.1 | 127.4 |
| 2016 | 169.0 | 195.0 | 190.1 | 179.8 | 171.7 | 172.5 | 170.7 | 184.5 | 205.8 | 187.1 | 164.4 | 175.5 |
| 2017 | 132.2 | 147.8 | 150.4 | 126.4 | 154.4 | 153.8 | 136.7 | 161.6 | 183.9 | 159.1 | 149.9 | 149.9 |
| 2018 | 162.5 | 161.3 | 153.7 | 157.8 | 135.4 | 153.3 | 143.0 | 152.7 | 137.8 | 137.8 | 125.2 | 126.2 |
| 2019 | 141.7 | 159.5 | 125.3 | 145.4 | 191.0 | 178.9 | 158.4 | 159.2 | 169.9 | 173.6 | 176.0 | 163.1 |
| 2020 | 167.0 | 123.8 | 206.5 | 143.7 | 127.3 | 116.9 | 124.5 | 137.4 | 135.6 | 138.5 | 147.0 | 156.5 |
| 2021 | 150.5 | 122.1 | 139.1 | 169.6 | 156.0 | 184.4 | 174.8 | 146.3 | 189.0 | 166.0 | 143.8 | 148.3 |
| 2022 | 145.4 | 174.0 | 143.0 | |||||||||
| - = No Data Reported; -- = Not Applicable; NA = Not Available; W = Withheld to avoid disclosure of individual company data. |
| Release Date: 6/1/2022 |
| Next Release Date: TBD |