|
Download Data (XLS File) |
|
||||||||
|
||||||||
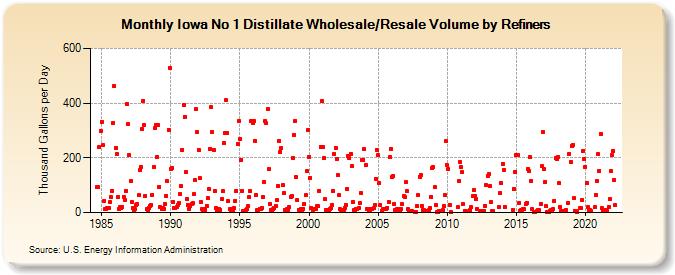
| Iowa No 1 Distillate Wholesale/Resale Volume by Refiners (Thousand Gallons per Day) | ||||||||
| Year | Jan | Feb | Mar | Apr | May | Jun | Jul | Aug | Sep | Oct | Nov | Dec |
|---|---|---|---|---|---|---|---|---|---|---|---|---|
| 1984 | 92.8 | 91.9 | 241.4 | 299.8 | ||||||||
| 1985 | 332.8 | 245.2 | 42.4 | 12.6 | 13.2 | 15.9 | 17.8 | 38.4 | 55.2 | 80.1 | 327.7 | 462.5 |
| 1986 | 235.8 | 215.6 | 58.1 | 14.0 | 22.1 | 15.4 | 20.7 | 58.5 | 46.1 | 80.4 | 397.4 | 322.1 |
| 1987 | 210.9 | 114.7 | 39.9 | 18.0 | 10.9 | 11.4 | 27.0 | 30.7 | 63.1 | 155.1 | 165.6 | 304.7 |
| 1988 | 409.3 | 319.1 | 61.5 | 11.5 | 9.4 | 18.3 | 25.2 | 28.4 | 65.9 | 167.2 | 307.3 | 320.5 |
| 1989 | 203.4 | 319.3 | 93.9 | 18.5 | 11.5 | 16.7 | 14.1 | 29.6 | 61.7 | 114.0 | 303.0 | 529.3 |
| 1990 | 158.4 | 164.5 | 39.5 | 15.5 | 15.2 | 19.4 | 28.5 | 35.1 | 66.5 | 95.5 | 229.8 | 392.1 |
| 1991 | 350.4 | 146.5 | 50.1 | 28.9 | 14.0 | 22.6 | 32.4 | 33.4 | 66.8 | 118.5 | 378.3 | 293.5 |
| 1992 | 230.1 | 126.2 | 39.9 | 12.4 | 8.6 | 13.2 | 10.5 | 24.3 | 52.7 | 85.2 | 233.7 | 385.3 |
| 1993 | 292.7 | 229.9 | 78.7 | 15.9 | 10.6 | 13.8 | 13.4 | 11.0 | 48.7 | 77.6 | 254.1 | 291.4 |
| 1994 | 409.9 | 291.6 | 41.2 | 11.4 | 9.9 | 13.7 | 7.8 | 15.0 | 43.4 | 80.6 | 250.6 | 335.2 |
| 1995 | 268.8 | 192.1 | 80.0 | 5.6 | 5.2 | 8.7 | 14.3 | 22.8 | 55.3 | 78.7 | 336.4 | 326.6 |
| 1996 | 333.9 | 263.1 | 65.0 | 9.0 | 7.6 | 13.7 | 11.9 | 18.1 | 55.2 | 113.5 | 334.2 | 325.8 |
| 1997 | 379.1 | 160.1 | 31.9 | 10.4 | 7.1 | 11.5 | 15.0 | 23.8 | 44.8 | 98.2 | 262.3 | 222.5 |
| 1998 | 235.1 | 99.1 | 70.9 | 10.4 | 7.0 | 11.5 | 10.6 | 18.9 | 58.0 | 61.2 | 199.5 | 284.5 |
| 1999 | 336.4 | 128.5 | 45.0 | 10.9 | 6.7 | 13.3 | 11.1 | 13.2 | 31.3 | 63.8 | 151.5 | 300.9 |
| 2000 | 204.2 | 127.8 | 17.5 | 8.7 | 14.6 | 13.5 | 13.9 | 24.2 | 22.7 | 79.7 | 239.9 | 406.9 |
| 2001 | 241.1 | 200.0 | 48.2 | 11.0 | 10.2 | 6.5 | 13.7 | 16.2 | 29.2 | 80.1 | 213.9 | 236.1 |
| 2002 | 196.5 | 135.9 | 63.9 | 11.4 | 10.5 | 9.5 | 9.4 | 18.0 | 29.3 | 87.3 | 205.7 | 198.5 |
| 2003 | 215.7 | 168.4 | 40.4 | 9.2 | 9.9 | 13.2 | 12.2 | 17.4 | 34.1 | 71.5 | 191.7 | 193.9 |
| 2004 | 232.2 | 172.9 | 14.4 | 11.2 | 8.9 | 10.7 | 11.2 | 13.9 | 17.5 | 27.5 | 123.4 | 230.0 |
| 2005 | 208.6 | 108.6 | 27.6 | 7.0 | 11.9 | 11.6 | 12.1 | 14.5 | 17.3 | 39.3 | 202.8 | 233.9 |
| 2006 | 129.5 | 134.4 | 31.8 | 8.7 | 12.7 | 12.6 | 7.8 | 6.9 | 12.7 | 33.1 | 58.8 | 56.7 |
| 2007 | 110.3 | 77.1 | 11.7 | 6.0 | 7.5 | 7.5 | W | W | 2.2 | 3.1 | 23.5 | 62.4 |
| 2008 | 131.4 | 135.5 | 24.5 | 8.8 | 9.1 | 4.9 | 7.1 | 6.3 | 8.6 | 17.0 | 58.2 | 162.3 |
| 2009 | 165.3 | 91.8 | 26.8 | 3.0 | 2.4 | 4.8 | 6.3 | 6.9 | 8.6 | 22.5 | 62.7 | 259.9 |
| 2010 | 172.8 | 158.6 | 28.1 | 2.5 | W | W | W | W | W | 19.6 | 114.3 | 184.9 |
| 2011 | 165.8 | 147.3 | 30.8 | 6.6 | 5.4 | W | W | W | 7.8 | 18.9 | 59.2 | 82.1 |
| 2012 | 59.7 | 49.5 | 12.8 | W | 5.2 | 5.2 | 6.7 | 5.0 | 7.4 | 24.9 | 99.8 | 133.9 |
| 2013 | 140.3 | 96.4 | 37.5 | 5.9 | 6.2 | W | W | W | - | 20.7 | 71.9 | 107.6 |
| 2014 | 178.4 | 156.5 | 20.4 | W | - | W | W | W | W | 10.8 | 87.1 | 149.7 |
| 2015 | 211.8 | 209.1 | 35.2 | 7.1 | 8.1 | 7.8 | 12.9 | 11.8 | 32.3 | 35.5 | 160.6 | 153.7 |
| 2016 | 201.5 | 115.9 | 12.7 | 2.2 | 3.2 | W | 4.4 | 10.4 | 9.3 | 32.1 | 169.0 | 294.3 |
| 2017 | 158.8 | 111.7 | 22.6 | 3.0 | 2.4 | 6.2 | 8.8 | 8.7 | 11.9 | 44.0 | 199.3 | 194.5 |
| 2018 | 204.0 | 107.2 | 21.7 | 5.7 | 6.6 | 7.5 | 6.9 | 10.2 | W | 36.3 | 215.4 | 185.0 |
| 2019 | 243.7 | 248.0 | 51.7 | 7.3 | 5.1 | 3.6 | W | 15.5 | 15.8 | 47.5 | 226.7 | 194.6 |
| 2020 | 167.6 | 108.7 | 19.4 | 10.2 | 8.8 | 5.5 | W | W | 19.4 | 66.0 | 116.1 | 213.8 |
| 2021 | 153.2 | 288.7 | 15.0 | 7.8 | 5.3 | W | 8.8 | 10.5 | 20.3 | 48.8 | 152.1 | 211.5 |
| 2022 | 225.8 | 120.0 | 26.3 | |||||||||
| - = No Data Reported; -- = Not Applicable; NA = Not Available; W = Withheld to avoid disclosure of individual company data. |
| Release Date: 6/1/2022 |
| Next Release Date: TBD |