|
Download Data (XLS File) |
|
||||||||
|
||||||||
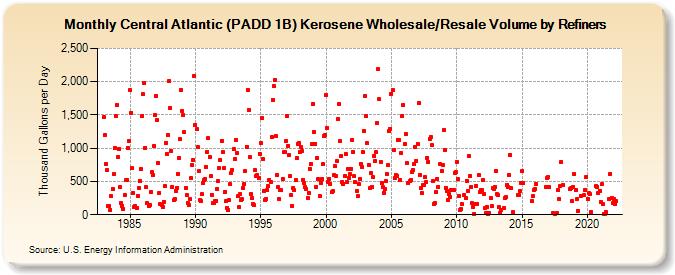
| Central Atlantic (PADD 1B) Kerosene Wholesale/Resale Volume by Refiners (Thousand Gallons per Day) | ||||||||
| Year | Jan | Feb | Mar | Apr | May | Jun | Jul | Aug | Sep | Oct | Nov | Dec |
|---|---|---|---|---|---|---|---|---|---|---|---|---|
| 1983 | 1,466.1 | 1,195.9 | 765.1 | 666.6 | 136.8 | 129.7 | 74.9 | 276.9 | 390.2 | 613.2 | 999.0 | 1,487.4 |
| 1984 | 1,650.1 | 868.2 | 988.7 | 409.9 | 177.1 | 133.9 | 85.2 | 298.4 | 516.4 | 526.7 | 1,009.2 | 1,108.5 |
| 1985 | 1,869.5 | 1,534.1 | 695.7 | 326.4 | 110.4 | 124.9 | 103.0 | 287.2 | 400.8 | 510.0 | 679.7 | 1,478.2 |
| 1986 | 1,808.3 | 1,979.6 | 1,007.5 | 411.3 | 169.2 | 127.3 | 151.9 | 343.8 | 634.7 | 591.6 | 1,035.8 | 1,506.2 |
| 1987 | 1,791.7 | 1,422.1 | 780.6 | 328.4 | 156.8 | 151.2 | 117.8 | 195.8 | 429.5 | 1,085.0 | 910.4 | 1,192.1 |
| 1988 | 2,016.4 | 1,610.3 | 956.0 | 420.2 | 215.1 | 232.3 | 362.8 | 407.5 | 618.6 | 857.2 | 1,135.5 | 1,877.9 |
| 1989 | 1,555.2 | 1,500.9 | 1,237.3 | 403.7 | 296.0 | 181.6 | 140.2 | 235.7 | 544.6 | 753.9 | 828.7 | 2,087.0 |
| 1990 | 1,347.4 | 1,281.4 | 1,020.0 | 658.6 | 214.6 | 200.8 | 305.5 | 473.1 | 515.3 | 540.6 | 718.0 | 947.6 |
| 1991 | 1,151.8 | 871.4 | 577.8 | 301.3 | 169.4 | 169.8 | 206.6 | 206.7 | 392.0 | 501.2 | 704.3 | 823.3 |
| 1992 | 1,114.5 | 939.7 | 699.7 | 345.1 | 200.8 | 104.2 | 78.3 | 220.1 | 458.9 | 620.2 | 669.9 | 981.6 |
| 1993 | 832.1 | 1,127.0 | 930.4 | 273.9 | 111.4 | 304.7 | 216.9 | 229.6 | 397.2 | 460.6 | 654.8 | 1,023.7 |
| 1994 | 1,879.3 | 1,577.0 | 865.1 | 307.6 | 245.3 | 162.3 | 139.4 | 666.2 | 582.4 | 592.5 | 552.5 | 917.4 |
| 1995 | 1,073.9 | 1,456.9 | 837.7 | 362.4 | 220.5 | 239.3 | 373.9 | 426.3 | 529.3 | 491.8 | 1,162.0 | 1,731.5 |
| 1996 | 1,940.6 | 2,031.8 | 1,182.7 | 594.6 | 411.9 | 233.2 | 377.3 | 364.6 | 538.5 | 937.7 | 939.8 | 1,105.6 |
| 1997 | 1,489.2 | 1,033.8 | 902.3 | 578.4 | 302.5 | 137.3 | 405.8 | 364.2 | 522.6 | 849.6 | 1,065.1 | 1,075.8 |
| 1998 | 941.5 | 1,014.4 | 956.6 | 521.9 | 469.6 | 416.6 | 391.2 | 255.5 | 327.4 | 693.1 | 765.5 | 1,056.6 |
| 1999 | 1,669.7 | 1,247.1 | 1,069.8 | 422.8 | 854.2 | 530.2 | 279.0 | 482.5 | 540.4 | 759.2 | 1,183.0 | 1,194.2 |
| 2000 | 1,803.1 | 1,307.5 | 488.5 | 541.4 | 459.2 | 337.6 | 350.3 | 592.6 | 730.1 | 587.4 | 804.1 | 1,442.0 |
| 2001 | 1,661.5 | 1,101.6 | 884.9 | 493.0 | 462.6 | 574.7 | 911.3 | 485.6 | 693.7 | 555.6 | 607.8 | 691.6 |
| 2002 | 1,129.6 | 941.5 | 576.0 | 485.5 | 358.8 | 277.4 | 456.7 | 538.0 | 765.2 | 724.6 | 941.0 | 1,260.6 |
| 2003 | 1,785.5 | 1,477.4 | 1,071.3 | 751.8 | 394.2 | 625.8 | 418.5 | 560.6 | 885.5 | 806.4 | 938.8 | 1,379.4 |
| 2004 | 2,184.1 | 1,735.1 | 796.2 | 476.8 | 410.3 | 331.8 | 379.1 | 500.0 | 609.7 | 742.8 | 1,258.0 | 1,294.5 |
| 2005 | 1,818.3 | 1,868.3 | 970.5 | 551.9 | 598.6 | 587.5 | 1,119.7 | 1,123.9 | 524.7 | 925.1 | 1,484.8 | 1,649.2 |
| 2006 | 1,063.9 | 1,209.9 | 769.8 | 470.0 | W | 509.1 | 524.3 | 644.7 | 669.8 | 756.5 | 1,017.7 | 812.5 |
| 2007 | 1,067.9 | 1,678.4 | 600.9 | 396.6 | 331.6 | 443.4 | 450.6 | 566.8 | 486.5 | 858.7 | 798.4 | 1,139.8 |
| 2008 | 1,173.7 | 1,041.9 | 503.1 | 165.5 | 183.1 | 343.8 | 537.8 | 422.0 | W | 755.0 | 657.4 | 752.2 |
| 2009 | 1,275.9 | 965.6 | 408.2 | 360.8 | 225.2 | 312.8 | 266.3 | 373.7 | 378.4 | 368.5 | 627.2 | 645.1 |
| 2010 | 793.5 | 530.8 | 281.3 | 76.9 | 79.4 | 154.8 | W | 300.3 | 246.9 | 512.1 | 362.7 | 879.5 |
| 2011 | 584.1 | 422.0 | 169.6 | 122.6 | 16.9 | 168.0 | 436.1 | 162.8 | 593.7 | 345.9 | 376.5 | 366.2 |
| 2012 | 527.6 | 313.9 | 97.5 | 24.3 | 120.7 | 11.4 | 24.0 | 257.5 | 134.5 | 403.1 | 390.6 | 422.9 |
| 2013 | 654.2 | 307.5 | 292.6 | 111.4 | 22.5 | 69.4 | W | 95.9 | 249.2 | 259.7 | 453.9 | 418.9 |
| 2014 | 595.2 | 898.4 | 395.5 | W | 35.3 | W | W | W | 293.4 | 300.5 | 355.3 | 482.8 |
| 2015 | 656.7 | 476.3 | W | W | W | W | W | W | W | 204.8 | 279.3 | 378.5 |
| 2016 | 385.5 | 463.7 | W | W | W | W | W | W | W | W | 416.7 | 554.5 |
| 2017 | 560.6 | 414.5 | W | W | 21.6 | W | 4.2 | W | 21.9 | 368.7 | 233.1 | 425.6 |
| 2018 | 789.2 | 442.4 | W | W | W | W | W | W | 393.6 | 396.5 | 205.0 | 413.7 |
| 2019 | 613.1 | 367.1 | 233.8 | 63.3 | W | W | 285.6 | W | W | 289.9 | 371.4 | 571.6 |
| 2020 | 243.4 | 321.4 | 306.6 | 37.7 | W | W | W | W | 429.0 | 420.4 | 318.9 | 363.1 |
| 2021 | 191.2 | 456.3 | 153.6 | 14.5 | 9.0 | 36.6 | W | W | 243.5 | 617.9 | 255.3 | 171.0 |
| 2022 | 241.0 | 159.0 | 206.8 | |||||||||
| - = No Data Reported; -- = Not Applicable; NA = Not Available; W = Withheld to avoid disclosure of individual company data. |
| Release Date: 6/1/2022 |
| Next Release Date: TBD |