|
Download Data (XLS File) |
|
||||||||
|
||||||||
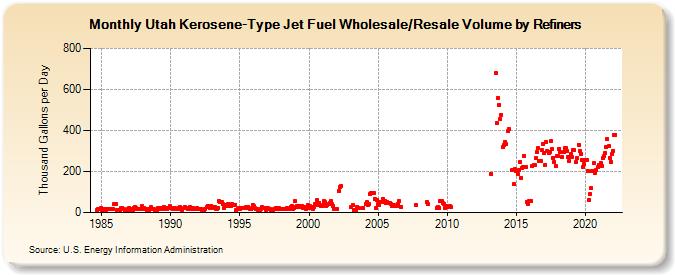
| Utah Kerosene-Type Jet Fuel Wholesale/Resale Volume by Refiners (Thousand Gallons per Day) | ||||||||
| Year | Jan | Feb | Mar | Apr | May | Jun | Jul | Aug | Sep | Oct | Nov | Dec |
|---|---|---|---|---|---|---|---|---|---|---|---|---|
| 1984 | 14.1 | 15.8 | 18.0 | 20.8 | ||||||||
| 1985 | 14.2 | 13.8 | 16.3 | 14.4 | 13.6 | 15.7 | 16.0 | 16.0 | 15.4 | 17.1 | 18.5 | 39.3 |
| 1986 | 41.9 | 14.1 | 14.4 | 10.6 | 13.2 | 20.7 | 21.6 | 19.3 | 13.8 | 13.0 | 12.3 | 15.4 |
| 1987 | 20.6 | 13.1 | 15.0 | 14.8 | 21.4 | 26.4 | 21.6 | 16.5 | 17.2 | 16.3 | 17.7 | 32.1 |
| 1988 | 23.3 | 22.2 | 18.1 | 11.6 | 16.0 | 13.4 | 16.6 | 25.6 | 15.8 | 15.5 | 10.7 | 13.2 |
| 1989 | 14.9 | 21.8 | 18.5 | 23.8 | 21.1 | 15.6 | 24.7 | 21.3 | 20.1 | 19.0 | 22.0 | 31.2 |
| 1990 | 20.2 | 23.8 | 19.1 | 15.7 | 20.1 | 19.2 | 19.4 | 24.2 | 27.7 | 16.4 | 14.3 | 20.0 |
| 1991 | 27.9 | 22.7 | 22.0 | 19.4 | 17.3 | 26.1 | 15.5 | 19.8 | 15.4 | 19.2 | 19.6 | 22.0 |
| 1992 | 18.2 | 15.0 | 18.9 | 14.3 | 14.4 | 14.7 | 19.6 | 26.6 | 31.5 | 25.8 | 22.0 | 33.8 |
| 1993 | 23.5 | 25.1 | 24.7 | 18.3 | 18.3 | 23.9 | 53.9 | 51.0 | 53.1 | 40.8 | 19.9 | 35.5 |
| 1994 | 31.9 | 32.0 | 43.1 | 33.3 | 32.0 | 40.7 | 35.8 | 36.5 | 38.6 | 14.5 | 18.8 | 22.2 |
| 1995 | 16.7 | 20.6 | 21.5 | 20.9 | 23.3 | 25.4 | 20.4 | 26.7 | 20.3 | 17.9 | 18.4 | 37.8 |
| 1996 | 29.8 | 21.1 | 19.0 | 18.7 | 14.2 | 12.8 | 19.0 | 26.8 | 24.2 | 21.6 | 20.2 | 14.3 |
| 1997 | 21.7 | 15.6 | 18.7 | 14.4 | 14.3 | 14.3 | 16.5 | 22.8 | 18.5 | 24.4 | 21.3 | 17.2 |
| 1998 | 19.7 | 19.1 | 17.7 | 16.0 | 17.8 | 22.5 | 15.1 | 17.1 | 27.2 | 31.0 | 19.4 | 20.7 |
| 1999 | 54.5 | 26.4 | 33.5 | 28.1 | 32.1 | 31.9 | 34.2 | 22.9 | 28.3 | 17.7 | 26.4 | 36.1 |
| 2000 | 23.6 | 30.0 | 28.5 | 17.6 | 28.3 | 39.7 | 39.7 | 59.6 | 37.9 | 48.0 | 32.5 | 32.3 |
| 2001 | 34.9 | 57.5 | 50.4 | 32.2 | 36.4 | 41.3 | 48.4 | 55.1 | 39.8 | 31.6 | 16.1 | 19.1 |
| 2002 | 19.5 | W | 105.9 | 125.9 | 128.9 | NA | NA | NA | NA | W | W | NA |
| 2003 | 25.5 | W | 34.9 | 13.9 | 10.7 | 10.4 | 27.6 | 24.0 | W | W | W | 24.4 |
| 2004 | W | 42.3 | 49.9 | 37.6 | 42.8 | 91.4 | 95.5 | 95.5 | 94.9 | 67.3 | 21.7 | 60.6 |
| 2005 | 40.2 | 38.2 | 53.5 | W | 67.1 | 53.5 | 57.2 | 48.4 | 51.8 | 46.2 | 45.5 | 42.4 |
| 2006 | 32.2 | 34.9 | 37.5 | 32.3 | 30.9 | 42.2 | 55.4 | W | 27.2 | W | W | W |
| 2007 | W | W | W | W | W | W | W | W | W | 35.1 | W | W |
| 2008 | W | W | W | W | W | W | 50.0 | 40.3 | W | W | W | W |
| 2009 | W | W | W | 21.8 | 26.1 | 24.4 | 56.1 | 54.7 | 45.2 | 42.4 | 23.5 | 30.0 |
| 2010 | 26.1 | W | 33.0 | 27.9 | W | W | W | W | W | W | W | W |
| 2011 | W | W | W | W | W | W | W | W | W | W | W | W |
| 2012 | W | W | W | W | W | W | W | W | W | W | W | W |
| 2013 | W | W | 190.3 | W | W | W | 680.6 | 436.7 | 559.2 | 526.5 | 453.6 | 476.8 |
| 2014 | 317.5 | 327.9 | 344.7 | 332.0 | W | 396.8 | 405.6 | W | 205.7 | W | 137.1 | 211.4 |
| 2015 | 203.0 | 189.0 | 206.6 | 245.2 | 168.6 | 218.1 | 219.8 | 273.9 | 224.4 | 51.0 | 42.6 | 56.9 |
| 2016 | 56.2 | 56.7 | 229.1 | 232.0 | 229.4 | 265.9 | 294.7 | 313.7 | 250.7 | 251.5 | 302.8 | 334.9 |
| 2017 | 288.2 | 233.5 | 344.0 | 300.7 | 290.1 | 293.9 | 347.3 | 308.2 | 267.5 | 246.8 | 225.5 | 275.7 |
| 2018 | 274.7 | 312.1 | 296.7 | NA | 271.4 | 294.0 | 313.9 | 313.8 | 302.3 | 269.1 | 252.3 | 285.2 |
| 2019 | 270.5 | 304.7 | 302.6 | W | 246.6 | 265.1 | 331.3 | 299.5 | 285.8 | 256.0 | 224.4 | 236.6 |
| 2020 | 255.3 | 256.2 | 202.9 | 61.2 | 90.4 | 118.0 | 204.0 | 240.0 | 191.7 | 207.8 | W | 224.4 |
| 2021 | 231.7 | 241.6 | 227.6 | 264.8 | 273.3 | 289.3 | 319.9 | 359.6 | 322.0 | 266.7 | 247.5 | 283.1 |
| 2022 | 300.8 | 377.6 | 380.2 | |||||||||
| - = No Data Reported; -- = Not Applicable; NA = Not Available; W = Withheld to avoid disclosure of individual company data. |
| Release Date: 6/1/2022 |
| Next Release Date: TBD |