|
Download Data (XLS File) |
|
||||||||
|
||||||||
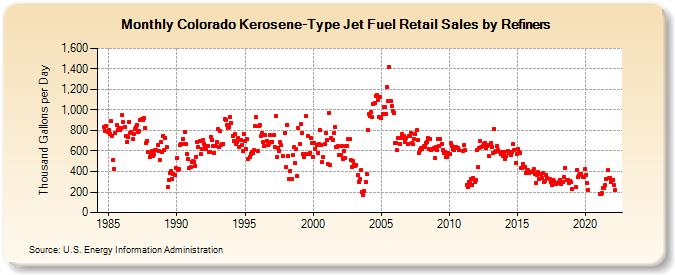
| Colorado Kerosene-Type Jet Fuel Retail Sales by Refiners (Thousand Gallons per Day) | ||||||||
| Year | Jan | Feb | Mar | Apr | May | Jun | Jul | Aug | Sep | Oct | Nov | Dec |
|---|---|---|---|---|---|---|---|---|---|---|---|---|
| 1984 | 832.9 | 796.5 | 845.9 | 788.1 | ||||||||
| 1985 | 806.3 | 767.9 | 897.1 | 750.2 | 515.7 | 426.9 | 774.8 | 853.2 | 805.0 | 828.2 | 806.5 | 822.8 |
| 1986 | 954.8 | 879.7 | 837.1 | 746.5 | 692.3 | 735.5 | 883.7 | 779.2 | 788.3 | 714.3 | 765.3 | 814.3 |
| 1987 | 832.6 | 856.9 | 780.7 | 792.0 | 901.6 | 908.4 | 898.7 | 921.7 | 826.6 | 680.6 | 701.3 | 588.9 |
| 1988 | 546.0 | 562.3 | 596.7 | 550.2 | 568.5 | 605.4 | 612.9 | 655.8 | 597.1 | 514.1 | 689.2 | 586.8 |
| 1989 | 747.1 | 605.0 | 726.7 | 642.2 | 253.5 | 313.5 | 384.2 | 402.4 | 327.7 | 376.9 | 368.1 | 438.9 |
| 1990 | 536.0 | 416.8 | 422.9 | 662.8 | 668.0 | 716.1 | 663.6 | 785.4 | 668.7 | 572.0 | 517.3 | 432.5 |
| 1991 | 445.5 | 489.3 | 500.2 | 495.5 | 457.1 | 545.7 | 684.9 | 640.5 | 693.5 | 566.9 | 623.1 | 711.4 |
| 1992 | 670.1 | 650.5 | 616.9 | 652.0 | 590.8 | 591.4 | 737.6 | 711.3 | 649.5 | 581.5 | 652.1 | 688.4 |
| 1993 | 810.5 | 635.6 | 796.7 | 662.4 | 667.5 | 668.5 | 911.3 | 897.7 | 858.1 | 820.4 | 832.9 | 932.3 |
| 1994 | 870.4 | 750.2 | 702.1 | 765.0 | 672.4 | 685.1 | 726.9 | 642.5 | 704.8 | 655.2 | 599.2 | 769.7 |
| 1995 | 698.6 | 622.5 | 715.3 | 520.6 | 546.1 | 573.3 | 585.7 | 581.6 | 610.5 | 839.3 | 927.3 | 598.9 |
| 1996 | 839.5 | 852.3 | 747.2 | 770.7 | 688.9 | 645.0 | 752.6 | 695.3 | 658.8 | 664.2 | 752.4 | 687.9 |
| 1997 | 691.0 | 752.2 | 638.1 | 940.1 | 542.7 | 631.2 | 601.2 | 685.0 | 654.6 | 549.9 | NA | 777.9 |
| 1998 | 442.4 | 855.6 | 553.8 | 329.6 | 405.2 | 331.6 | 564.7 | 635.1 | 483.6 | 616.2 | 357.7 | 820.4 |
| 1999 | 668.0 | 863.8 | 777.9 | 572.7 | 542.5 | 573.1 | 937.1 | 748.7 | 575.4 | 583.3 | 722.9 | 678.7 |
| 2000 | 546.0 | 681.6 | 623.5 | 654.0 | 584.5 | 671.2 | 801.1 | 654.1 | 491.8 | 541.5 | 670.3 | 771.5 |
| 2001 | 710.2 | 469.9 | 973.6 | 461.1 | 724.1 | 703.4 | 772.1 | 831.5 | 643.3 | 637.7 | 644.4 | 556.2 |
| 2002 | 559.0 | 645.5 | 519.7 | 598.9 | 536.0 | 648.5 | 651.3 | 718.5 | 720.2 | 512.0 | 446.0 | 504.3 |
| 2003 | 466.0 | 453.9 | 466.0 | 364.5 | 302.7 | 323.3 | 413.2 | 196.1 | 174.7 | 209.6 | 302.5 | 374.0 |
| 2004 | 806.5 | 958.0 | 937.7 | 979.4 | 930.7 | 1,060.9 | 1,072.5 | 1,134.5 | 1,148.9 | 1,094.4 | 933.5 | 1,122.7 |
| 2005 | 923.5 | 962.1 | 1,030.5 | 1,033.2 | 964.5 | 1,224.2 | 1,083.2 | 1,416.9 | 1,084.1 | 1,040.3 | 987.6 | 973.7 |
| 2006 | 679.4 | 678.3 | 606.0 | 730.9 | 667.5 | 731.5 | 768.4 | 728.4 | 747.6 | 687.8 | 728.1 | 669.1 |
| 2007 | 745.2 | 746.3 | 775.9 | 676.9 | 663.4 | 712.3 | 760.9 | 802.6 | 709.7 | 583.3 | 610.7 | 628.9 |
| 2008 | 616.7 | 646.2 | 636.2 | 679.6 | 684.8 | 725.1 | 615.9 | 717.4 | 605.7 | 621.2 | 631.9 | 536.5 |
| 2009 | 639.9 | 613.3 | 716.8 | 646.9 | 717.9 | 669.8 | 610.2 | 576.7 | 587.1 | 536.7 | 546.3 | 576.8 |
| 2010 | 571.3 | 676.7 | 644.7 | 622.2 | 610.1 | 636.0 | 642.9 | 632.4 | 605.6 | NA | NA | NA |
| 2011 | 602.6 | 658.6 | 605.9 | 271.8 | 252.9 | 298.8 | 287.6 | 326.6 | 267.8 | 337.0 | 300.2 | 314.9 |
| 2012 | 611.4 | 444.0 | 629.1 | 694.0 | 636.0 | 647.1 | 670.3 | 681.5 | 625.9 | 647.2 | 659.9 | 547.6 |
| 2013 | 678.8 | 642.6 | 579.5 | 818.3 | 592.6 | 599.2 | 646.4 | 605.9 | 588.6 | 566.8 | 586.2 | 549.4 |
| 2014 | 590.4 | 520.6 | 550.2 | 597.2 | 581.0 | 594.4 | 561.2 | 593.3 | 664.5 | 611.8 | 487.4 | 572.0 |
| 2015 | 618.0 | 589.1 | 580.9 | 433.0 | 433.5 | 476.6 | 446.0 | 389.4 | 400.9 | 412.3 | 387.1 | 397.5 |
| 2016 | 395.2 | 404.1 | 420.7 | 374.3 | 292.0 | 365.0 | 395.3 | 327.2 | 376.5 | 337.8 | 381.3 | 294.8 |
| 2017 | 309.3 | 364.6 | 335.0 | W | 323.5 | 295.5 | 265.5 | 318.9 | 312.3 | W | 275.1 | 291.2 |
| 2018 | 296.1 | 319.9 | 280.9 | W | 298.7 | 351.4 | 436.2 | 319.1 | 322.0 | 285.7 | 303.8 | 296.9 |
| 2019 | 226.9 | W | W | 251.5 | 415.8 | 345.4 | 368.2 | 378.7 | 371.1 | 343.6 | 343.1 | 423.6 |
| 2020 | 368.8 | 291.7 | 224.3 | W | W | W | W | W | W | W | W | W |
| 2021 | 181.1 | 182.5 | 186.7 | 244.2 | 239.0 | 265.6 | 327.2 | 413.9 | 336.0 | 340.9 | 294.9 | 321.6 |
| 2022 | 320.5 | 267.6 | 216.0 | |||||||||
| - = No Data Reported; -- = Not Applicable; NA = Not Available; W = Withheld to avoid disclosure of individual company data. |
| Release Date: 6/1/2022 |
| Next Release Date: TBD |