|
Download Data (XLS File) |
|
||||||||
|
||||||||
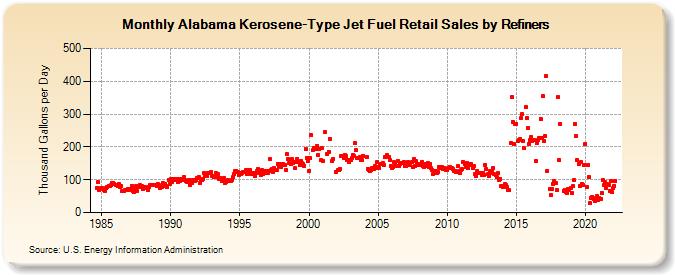
| Alabama Kerosene-Type Jet Fuel Retail Sales by Refiners (Thousand Gallons per Day) | ||||||||
| Year | Jan | Feb | Mar | Apr | May | Jun | Jul | Aug | Sep | Oct | Nov | Dec |
|---|---|---|---|---|---|---|---|---|---|---|---|---|
| 1984 | 75.7 | 92.0 | 69.3 | 73.5 | ||||||||
| 1985 | 75.6 | 72.3 | 68.6 | 66.6 | 73.8 | 77.5 | 81.6 | 80.2 | 83.0 | 91.1 | 89.7 | 86.8 |
| 1986 | 83.5 | 84.3 | 80.7 | 86.9 | 77.5 | 81.0 | 66.6 | 64.9 | 68.2 | 70.0 | 70.2 | 72.6 |
| 1987 | 69.3 | 71.9 | 82.3 | 65.3 | 61.1 | 73.7 | 81.9 | 65.2 | 77.1 | 82.8 | 78.8 | 79.5 |
| 1988 | 72.2 | 75.9 | 77.8 | 74.0 | 69.0 | 79.2 | 83.4 | 85.3 | 83.6 | 83.9 | 84.2 | 83.3 |
| 1989 | 79.5 | 86.9 | 83.1 | 75.8 | 77.7 | 90.9 | 83.5 | 87.5 | 82.3 | 77.6 | 99.5 | 87.2 |
| 1990 | 102.3 | 94.5 | 103.4 | 99.5 | 103.0 | 102.2 | 91.9 | 102.1 | 96.5 | 102.3 | 98.0 | 108.1 |
| 1991 | 97.7 | 95.1 | 93.6 | 96.8 | 100.0 | 85.3 | 90.6 | 99.7 | 100.1 | 96.9 | 99.3 | 105.4 |
| 1992 | 108.5 | 89.7 | 98.1 | 99.4 | 102.7 | 120.0 | 112.8 | 112.6 | 120.0 | 120.7 | W | 123.5 |
| 1993 | 110.8 | 107.5 | 110.7 | 119.1 | 108.3 | 116.7 | 103.0 | 105.3 | 96.6 | 97.1 | 105.5 | 90.6 |
| 1994 | 93.3 | 96.6 | 97.9 | 95.4 | 97.3 | 100.6 | 108.0 | 116.9 | 125.6 | 126.8 | 123.5 | 115.5 |
| 1995 | 120.0 | 116.7 | 120.6 | 122.9 | 124.3 | 128.5 | 116.4 | 121.1 | 129.9 | 128.5 | 116.4 | 121.8 |
| 1996 | 120.4 | 110.0 | 120.6 | 126.0 | 133.3 | 120.8 | 114.4 | 129.5 | 118.9 | 127.2 | 121.8 | 126.2 |
| 1997 | 121.2 | 125.5 | 161.8 | 128.6 | 131.9 | 124.9 | 135.0 | 128.1 | 131.1 | 147.5 | 140.3 | 147.2 |
| 1998 | 139.1 | 148.0 | 145.5 | 143.6 | 129.8 | 177.0 | 162.5 | 152.0 | 148.0 | 161.9 | 151.9 | 152.9 |
| 1999 | 134.5 | 153.5 | 164.2 | 152.5 | 143.9 | 157.2 | 150.1 | 147.4 | 142.7 | 193.0 | 167.4 | 155.7 |
| 2000 | 126.3 | 166.0 | 235.5 | 189.6 | 197.8 | 192.9 | 194.2 | 203.6 | 174.5 | 192.4 | 159.1 | 196.1 |
| 2001 | 158.2 | W | 244.1 | W | 177.7 | 185.9 | 225.1 | W | 156.9 | 162.3 | W | 124.2 |
| 2002 | W | 128.7 | 128.7 | 134.1 | 171.1 | 172.1 | 165.8 | 175.5 | 171.7 | 158.7 | 160.9 | 154.7 |
| 2003 | 161.1 | 165.4 | 176.4 | 171.9 | 210.8 | 189.2 | 167.2 | 166.6 | 169.3 | 161.6 | 159.9 | 172.5 |
| 2004 | W | W | 168.0 | 134.0 | 128.2 | 127.9 | 129.4 | 135.9 | 133.8 | 140.4 | 136.8 | 153.2 |
| 2005 | 139.0 | 135.9 | 149.3 | 147.6 | 151.0 | 145.8 | 169.0 | 169.9 | 173.8 | 168.0 | 159.0 | 142.4 |
| 2006 | 134.3 | 139.6 | 153.1 | 147.7 | 142.9 | 157.6 | 142.6 | 146.6 | 149.8 | 151.6 | 153.8 | 141.3 |
| 2007 | 140.6 | 151.1 | 152.5 | 143.5 | 152.3 | 153.1 | 139.5 | 162.6 | 141.2 | 157.0 | 149.1 | 145.3 |
| 2008 | 147.2 | 143.7 | 154.5 | 140.3 | 140.1 | 146.9 | 142.3 | 150.9 | 138.2 | 147.5 | 134.5 | 130.3 |
| 2009 | 118.9 | 125.4 | 127.0 | 119.9 | 122.8 | 139.8 | 135.8 | 139.2 | 132.9 | 135.4 | 131.7 | 129.9 |
| 2010 | 128.9 | 135.2 | 138.9 | 137.2 | 134.9 | 131.6 | 125.5 | 127.6 | 122.4 | 141.0 | 125.7 | 121.0 |
| 2011 | 128.1 | 131.9 | 154.0 | 147.5 | 138.5 | 149.8 | 134.8 | 148.6 | 143.9 | 146.9 | 135.3 | 140.6 |
| 2012 | 118.1 | 110.7 | 126.1 | 119.9 | 121.7 | 121.0 | 114.0 | 121.9 | 115.6 | 143.7 | 132.6 | 116.9 |
| 2013 | 110.6 | 125.5 | 119.0 | 126.5 | 134.6 | 116.2 | 115.6 | 107.8 | 119.0 | 98.7 | 101.5 | 82.0 |
| 2014 | 78.4 | 81.0 | 86.2 | 84.8 | 77.1 | 70.2 | 67.2 | 210.6 | 350.9 | 276.9 | 209.2 | 269.7 |
| 2015 | 270.6 | 218.0 | 219.8 | 223.0 | 288.5 | 298.9 | 217.6 | 195.7 | 321.3 | 288.5 | 257.9 | 209.9 |
| 2016 | 220.0 | 229.9 | 218.3 | 221.8 | NA | 157.1 | 211.5 | 219.9 | 228.0 | 284.3 | 228.4 | 354.2 |
| 2017 | 217.3 | 232.6 | 415.1 | 127.6 | NA | 71.3 | 52.4 | 71.2 | 86.3 | 95.2 | 90.7 | 68.4 |
| 2018 | 352.1 | 159.7 | 269.0 | NA | NA | 67.0 | 68.8 | 61.6 | 58.5 | 72.2 | 70.0 | 73.5 |
| 2019 | 60.1 | 80.6 | 98.9 | 269.7 | 232.4 | 158.7 | 146.4 | 80.2 | 153.4 | 86.6 | 85.3 | 146.3 |
| 2020 | 209.6 | 77.6 | 144.9 | 106.9 | 28.7 | 44.6 | 48.5 | 41.7 | 34.5 | 43.0 | 49.9 | 39.6 |
| 2021 | 44.9 | 42.8 | 59.6 | 98.9 | 83.7 | 92.2 | 73.9 | 86.3 | 84.3 | 65.9 | 95.4 | 63.0 |
| 2022 | 73.9 | 82.2 | 96.6 | |||||||||
| - = No Data Reported; -- = Not Applicable; NA = Not Available; W = Withheld to avoid disclosure of individual company data. |
| Release Date: 6/1/2022 |
| Next Release Date: TBD |