|
Download Data (XLS File) |
|
||||||||
|
||||||||
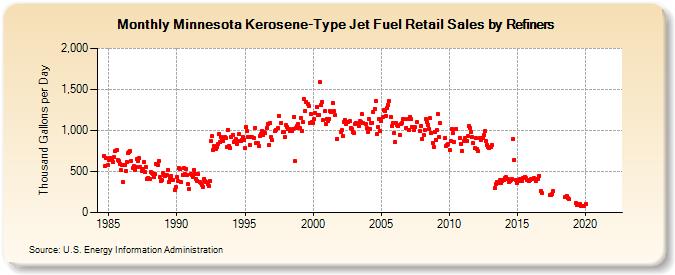
| Minnesota Kerosene-Type Jet Fuel Retail Sales by Refiners (Thousand Gallons per Day) | ||||||||
| Year | Jan | Feb | Mar | Apr | May | Jun | Jul | Aug | Sep | Oct | Nov | Dec |
|---|---|---|---|---|---|---|---|---|---|---|---|---|
| 1984 | 688.8 | 561.5 | 659.9 | 575.1 | ||||||||
| 1985 | 643.7 | 662.3 | 666.4 | 652.9 | 613.4 | 670.9 | 751.3 | 760.1 | 639.4 | 625.4 | 596.4 | 514.1 |
| 1986 | 575.1 | 368.7 | 577.2 | 510.9 | 614.7 | 722.8 | 741.7 | 750.3 | 631.5 | 543.1 | 562.0 | 522.2 |
| 1987 | 559.2 | 653.7 | 628.9 | 663.7 | 553.1 | 507.8 | 535.6 | 622.0 | 494.1 | 552.0 | 404.6 | 424.3 |
| 1988 | 412.7 | 492.8 | 487.1 | 474.8 | 435.5 | 465.0 | 593.4 | 575.8 | 632.5 | 427.5 | 386.1 | 390.9 |
| 1989 | 477.5 | 453.2 | 445.5 | 461.7 | 517.6 | 371.8 | 426.9 | 443.4 | 401.5 | 399.0 | 277.9 | 308.3 |
| 1990 | 436.6 | 382.7 | 539.9 | 524.8 | 367.4 | 460.5 | 542.3 | 470.3 | 533.6 | 457.0 | 341.9 | 288.4 |
| 1991 | 470.3 | 457.1 | 434.4 | 522.8 | 475.3 | 414.5 | 385.1 | 469.5 | 370.7 | 357.1 | 337.3 | 306.7 |
| 1992 | 414.0 | 381.0 | 370.9 | 342.2 | 319.9 | 383.1 | 867.2 | 929.7 | 760.8 | 816.7 | 768.7 | 796.4 |
| 1993 | 833.3 | 953.8 | 859.8 | 920.0 | 884.1 | 869.5 | 924.3 | 904.9 | 803.6 | 1,009.7 | 815.9 | 786.9 |
| 1994 | 918.3 | 948.6 | 856.3 | 873.4 | 892.4 | 835.6 | 871.2 | 951.7 | 867.3 | 887.9 | 923.5 | 888.4 |
| 1995 | 781.0 | 1,045.3 | 992.6 | 921.3 | 826.5 | 914.6 | 921.7 | W | 904.0 | 1,035.9 | 846.3 | 846.7 |
| 1996 | 808.9 | 928.4 | 954.2 | 999.4 | 950.2 | 979.3 | 969.1 | 1,032.6 | 1,075.3 | 817.9 | 1,094.0 | 923.1 |
| 1997 | 878.5 | W | 993.1 | 1,005.9 | W | 1,032.5 | 1,178.0 | W | 1,094.4 | 975.9 | 978.8 | 918.9 |
| 1998 | 1,063.1 | 1,044.7 | 1,012.0 | 1,018.7 | 997.7 | 998.8 | 1,012.7 | 1,167.8 | 624.5 | 1,034.8 | 1,056.4 | 1,074.9 |
| 1999 | 1,029.1 | 1,155.2 | 998.7 | 1,097.6 | 1,385.6 | 1,235.5 | 1,351.6 | 1,316.5 | 1,301.2 | 1,092.1 | 1,205.5 | 1,101.5 |
| 2000 | 1,089.2 | 1,135.4 | 1,215.6 | 1,291.0 | 1,186.9 | 1,190.3 | 1,585.9 | 1,309.2 | 1,348.6 | 1,122.0 | 1,239.7 | 1,079.7 |
| 2001 | 1,138.1 | 1,112.2 | 1,138.8 | 1,237.2 | 1,221.5 | 1,340.3 | 1,231.4 | 1,188.3 | W | 900.7 | W | W |
| 2002 | 980.2 | 1,002.6 | 934.2 | 1,106.0 | 1,126.0 | 1,075.2 | 1,102.9 | 1,100.3 | 1,110.5 | 1,034.4 | 1,018.5 | 987.2 |
| 2003 | 966.1 | 1,078.3 | 1,093.3 | 1,083.4 | 1,048.8 | 1,114.8 | 1,108.7 | 1,196.3 | 1,087.4 | W | 1,079.7 | 1,026.1 |
| 2004 | 986.0 | 1,142.1 | 1,023.4 | 1,085.4 | 1,095.7 | 1,224.2 | 1,262.6 | 1,361.1 | 951.2 | 1,046.3 | 1,145.5 | 992.2 |
| 2005 | 1,117.4 | 1,158.6 | 1,249.5 | 1,233.6 | 1,177.3 | 1,268.5 | 1,310.0 | 1,356.7 | 1,170.1 | 1,058.8 | 1,091.3 | 970.6 |
| 2006 | 863.9 | 1,094.0 | 1,070.0 | 1,057.4 | 949.9 | 1,074.0 | 1,093.0 | 1,136.7 | 1,135.3 | W | 1,033.6 | 1,137.5 |
| 2007 | 1,000.4 | 1,161.8 | 1,137.5 | 1,048.0 | W | 1,005.0 | 1,037.4 | 1,097.4 | W | W | 990.8 | 1,058.6 |
| 2008 | 896.8 | 948.8 | 1,010.7 | 1,137.1 | 1,108.6 | 1,070.5 | 1,014.2 | 1,146.9 | 971.5 | 852.0 | 800.6 | 984.8 |
| 2009 | 881.6 | 1,001.9 | 1,199.0 | 919.0 | 1,087.1 | W | W | W | 909.0 | 808.9 | 823.8 | 831.9 |
| 2010 | 756.2 | 874.3 | 1,018.8 | 964.4 | 861.0 | W | 1,019.2 | W | W | 913.9 | 839.4 | 751.5 |
| 2011 | W | 866.7 | 904.3 | 876.9 | 928.6 | 1,052.5 | 1,032.6 | 984.9 | 920.3 | 842.2 | 782.4 | 907.4 |
| 2012 | 779.8 | 745.2 | W | 905.0 | 889.6 | 910.4 | 942.5 | 987.6 | 867.7 | 828.8 | 800.9 | 781.2 |
| 2013 | 800.2 | 825.2 | NA | NA | 299.8 | 342.5 | 370.8 | 359.4 | 392.9 | 364.1 | 381.7 | 392.1 |
| 2014 | 393.3 | 426.5 | 428.1 | 404.0 | 376.8 | 389.2 | 392.3 | 405.5 | 895.4 | 641.2 | 398.5 | 359.3 |
| 2015 | 386.7 | 397.3 | 411.2 | 385.2 | 380.5 | 417.4 | 435.7 | 415.9 | 396.2 | 390.8 | 380.3 | 393.1 |
| 2016 | 412.6 | 402.9 | 420.2 | W | 387.8 | 414.5 | 408.9 | 449.2 | 262.8 | 235.7 | W | W |
| 2017 | W | W | W | W | 209.1 | 210.8 | 220.9 | 257.6 | W | W | W | W |
| 2018 | W | W | W | W | W | W | 184.0 | 204.5 | 173.2 | 161.6 | W | W |
| 2019 | W | W | W | 118.3 | 95.4 | 108.8 | 91.3 | 102.0 | 75.0 | 76.6 | 84.3 | W |
| 2020 | 103.1 | W | W | W | W | W | W | W | W | W | W | W |
| 2021 | W | W | W | W | W | W | W | W | W | W | W | W |
| 2022 | W | W | W | |||||||||
| - = No Data Reported; -- = Not Applicable; NA = Not Available; W = Withheld to avoid disclosure of individual company data. |
| Release Date: 6/1/2022 |
| Next Release Date: TBD |