|
Download Data (XLS File) |
|
||||||||
|
||||||||
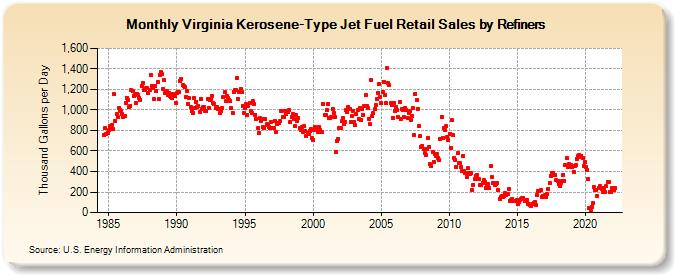
| Virginia Kerosene-Type Jet Fuel Retail Sales by Refiners (Thousand Gallons per Day) | ||||||||
| Year | Jan | Feb | Mar | Apr | May | Jun | Jul | Aug | Sep | Oct | Nov | Dec |
|---|---|---|---|---|---|---|---|---|---|---|---|---|
| 1984 | 759.7 | 823.7 | 761.0 | 778.1 | ||||||||
| 1985 | 803.4 | 847.3 | 829.6 | 856.5 | 809.9 | 1,153.5 | 891.5 | 962.1 | 935.1 | 1,022.3 | 1,003.1 | 990.2 |
| 1986 | 958.6 | 930.7 | 945.6 | 1,069.6 | 1,120.4 | 1,099.8 | 1,028.6 | 1,038.2 | 1,193.8 | 1,184.0 | 1,137.4 | 1,153.1 |
| 1987 | 1,063.5 | 1,155.6 | 1,143.2 | 1,117.2 | 1,099.9 | 1,238.3 | 1,264.5 | 1,192.6 | 1,192.8 | 1,210.4 | 1,209.4 | 1,163.7 |
| 1988 | 1,192.7 | 1,337.0 | 1,235.1 | 1,211.4 | 1,106.5 | 1,232.0 | 1,184.8 | 1,273.5 | 1,104.5 | 1,340.1 | 1,365.8 | 1,346.0 |
| 1989 | 1,208.9 | 1,288.1 | 1,167.5 | 1,184.1 | 1,148.5 | 1,162.6 | 1,137.6 | 1,127.1 | 1,116.4 | 1,151.6 | 1,140.3 | 1,069.8 |
| 1990 | 1,161.5 | 1,179.6 | 1,176.9 | 1,284.9 | 1,303.1 | 1,239.0 | 1,228.9 | 1,220.7 | 1,126.9 | 1,184.3 | 1,055.3 | 1,114.4 |
| 1991 | 1,030.9 | 991.3 | 973.3 | 1,120.2 | 1,017.1 | 1,082.0 | 1,030.8 | 1,037.3 | 977.4 | 1,111.1 | 1,013.2 | 1,026.7 |
| 1992 | 1,029.5 | 993.4 | 990.8 | 1,104.9 | 1,021.4 | 1,101.8 | 1,107.8 | 1,140.8 | 1,068.5 | 1,058.9 | 1,021.0 | 1,028.7 |
| 1993 | 1,013.5 | 1,011.6 | 973.6 | 988.9 | 1,015.7 | 1,127.1 | 1,172.5 | 1,082.6 | 1,140.8 | 1,112.0 | 1,101.0 | 1,083.7 |
| 1994 | 1,020.9 | 973.9 | 1,179.4 | 1,190.8 | 1,196.4 | 1,309.5 | 1,108.8 | 1,177.6 | 1,205.9 | 1,172.4 | 1,040.3 | 974.9 |
| 1995 | 1,016.0 | 1,056.3 | 951.2 | 1,041.7 | 1,066.9 | 992.4 | 972.3 | 1,085.6 | 1,056.2 | 950.9 | 914.7 | 820.6 |
| 1996 | 778.5 | 919.7 | 890.0 | 911.1 | 829.6 | 827.6 | 912.3 | 860.2 | 853.9 | 834.6 | 820.8 | 883.5 |
| 1997 | 821.7 | 820.4 | 896.0 | 785.9 | 864.4 | 876.4 | 876.9 | 891.7 | 993.0 | 931.1 | 926.9 | 993.0 |
| 1998 | 962.4 | 989.5 | 982.2 | 996.2 | 880.9 | 931.4 | 956.2 | 908.3 | 841.9 | 947.8 | 891.3 | 923.8 |
| 1999 | 823.2 | 805.5 | 835.5 | 789.8 | 843.4 | 798.6 | 745.5 | 776.9 | 766.9 | 794.7 | 811.4 | 724.9 |
| 2000 | 709.5 | 808.9 | 833.1 | 826.4 | 785.9 | 833.8 | 803.6 | 782.8 | 789.2 | 1,055.7 | 952.5 | 948.1 |
| 2001 | 1,001.5 | 1,060.2 | 917.8 | 924.6 | 935.5 | 1,013.4 | 972.9 | 928.6 | 587.3 | 693.9 | 721.5 | 828.3 |
| 2002 | 823.0 | 888.9 | 920.0 | 858.6 | 885.0 | 995.7 | 976.3 | 1,031.4 | 1,013.3 | 884.8 | 945.3 | 987.2 |
| 2003 | 886.2 | 853.0 | 958.2 | 1,002.1 | 912.9 | 1,014.5 | 904.2 | 1,008.5 | 955.1 | 1,038.4 | 1,145.2 | 1,040.0 |
| 2004 | 1,016.0 | 916.5 | 860.6 | 1,292.3 | 936.8 | 965.6 | 1,005.8 | 1,044.2 | 1,103.1 | 1,166.2 | 1,254.5 | 1,125.3 |
| 2005 | 1,064.1 | 1,174.5 | 1,275.0 | 1,143.5 | 1,065.4 | 1,405.4 | 1,263.2 | 1,240.5 | 1,064.4 | 1,046.4 | 924.2 | 1,069.8 |
| 2006 | 993.5 | 1,031.6 | 1,002.1 | 927.9 | 1,081.6 | 907.1 | 1,004.8 | 995.6 | 930.1 | 1,017.5 | 1,000.9 | 926.2 |
| 2007 | 973.4 | 990.9 | 898.8 | 943.8 | 1,018.9 | 755.2 | 1,159.9 | 1,097.3 | 1,011.6 | 842.7 | 743.4 | 640.3 |
| 2008 | 650.0 | 623.7 | 582.5 | 557.6 | 619.5 | 726.5 | 643.5 | 469.5 | 453.6 | 587.8 | 495.3 | 574.8 |
| 2009 | 548.7 | 567.6 | 535.6 | 512.7 | 719.9 | 935.0 | 729.3 | 824.1 | 804.5 | 839.8 | 732.2 | 708.0 |
| 2010 | 767.2 | 630.5 | 898.4 | 751.1 | 532.0 | 516.1 | 448.3 | 575.9 | 480.7 | 479.9 | 439.5 | 401.0 |
| 2011 | 551.5 | 404.4 | 383.7 | 347.8 | 431.3 | 385.3 | 374.2 | 384.3 | 217.0 | 272.3 | 325.0 | 352.9 |
| 2012 | 367.0 | 322.3 | 324.2 | 270.1 | 273.2 | 291.5 | 313.4 | 294.5 | 238.3 | 274.8 | 277.0 | 237.6 |
| 2013 | 449.3 | 343.0 | 284.7 | 285.1 | 268.1 | 275.4 | 283.8 | 219.7 | 134.7 | 154.0 | 159.5 | 155.9 |
| 2014 | 165.6 | 185.8 | 175.9 | 176.4 | 229.7 | 116.3 | 120.9 | 133.2 | 116.5 | 117.2 | 117.2 | 124.6 |
| 2015 | 82.2 | 107.6 | 118.2 | 134.0 | 139.5 | 141.8 | 113.1 | 124.0 | 121.1 | 81.7 | 82.7 | 77.5 |
| 2016 | 67.0 | 84.8 | 97.3 | 103.8 | 74.8 | 175.6 | 209.8 | 211.5 | 216.7 | 152.5 | 157.4 | 160.2 |
| 2017 | 167.9 | 150.9 | 176.8 | 231.7 | 289.4 | 355.3 | 390.1 | 387.0 | 368.8 | 366.2 | 317.0 | 311.1 |
| 2018 | 276.0 | 257.2 | 291.9 | 304.7 | 370.6 | 306.7 | 460.6 | 533.6 | 447.7 | 473.2 | 456.9 | 463.4 |
| 2019 | 441.7 | 399.4 | 458.6 | 458.8 | 525.1 | 551.5 | 558.4 | 540.8 | 555.2 | 535.2 | 455.9 | 494.5 |
| 2020 | 440.5 | 416.6 | 328.6 | 43.8 | 13.3 | 57.9 | 92.8 | 245.1 | 218.8 | 220.9 | 164.9 | 237.4 |
| 2021 | 254.8 | 237.0 | 224.8 | 201.6 | 240.6 | 200.8 | 256.6 | 300.2 | 297.3 | 203.5 | 200.1 | 234.7 |
| 2022 | 236.0 | 219.5 | 236.0 | |||||||||
| - = No Data Reported; -- = Not Applicable; NA = Not Available; W = Withheld to avoid disclosure of individual company data. |
| Release Date: 6/1/2022 |
| Next Release Date: TBD |