|
Download Data (XLS File) |
|
||||||||
|
||||||||
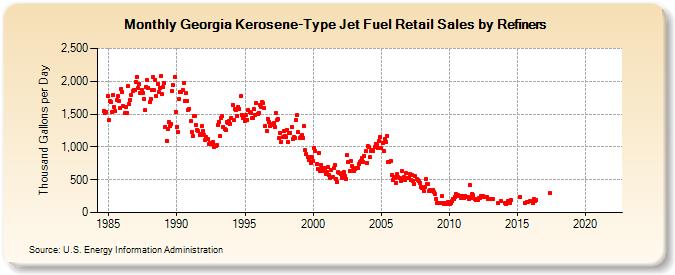
| Georgia Kerosene-Type Jet Fuel Retail Sales by Refiners (Thousand Gallons per Day) | ||||||||
| Year | Jan | Feb | Mar | Apr | May | Jun | Jul | Aug | Sep | Oct | Nov | Dec |
|---|---|---|---|---|---|---|---|---|---|---|---|---|
| 1984 | 1,548.2 | 1,515.5 | 1,537.2 | 1,779.6 | ||||||||
| 1985 | 1,403.6 | 1,694.2 | 1,684.0 | 1,530.4 | 1,787.5 | 1,612.1 | 1,547.7 | 1,706.7 | 1,767.6 | 1,696.5 | 1,590.2 | 1,885.0 |
| 1986 | 1,837.7 | 1,621.4 | 1,508.9 | 1,614.4 | 1,519.6 | 1,922.8 | 1,645.7 | 1,718.7 | 1,789.8 | 1,846.5 | 1,864.8 | 1,872.0 |
| 1987 | 1,995.4 | 2,064.5 | 1,893.2 | 1,962.5 | 1,820.3 | 1,866.7 | 1,826.4 | 1,733.6 | 1,557.7 | 1,917.5 | 2,020.4 | 1,901.0 |
| 1988 | 1,677.1 | 1,732.8 | 1,865.8 | 2,069.7 | 1,861.1 | 2,023.9 | 1,769.0 | 1,961.5 | 1,836.5 | 1,896.4 | 2,078.5 | 1,798.4 |
| 1989 | 1,909.9 | 1,969.8 | 1,302.9 | 1,095.5 | 1,274.3 | 1,379.6 | 1,312.7 | 1,353.1 | 1,858.3 | 1,941.7 | 2,062.2 | 1,537.4 |
| 1990 | 1,310.2 | 1,228.6 | 1,725.4 | 1,831.2 | 1,828.7 | 1,866.2 | 1,975.2 | 1,699.9 | 1,816.0 | 1,706.0 | 1,569.2 | 1,581.6 |
| 1991 | 1,386.8 | 1,228.9 | 1,166.9 | 1,472.8 | 1,471.3 | 1,340.3 | 1,262.7 | 1,238.8 | 1,182.2 | 1,197.6 | 1,312.0 | 1,246.5 |
| 1992 | 1,187.8 | 1,109.6 | 1,148.9 | 1,114.6 | 1,048.6 | 1,066.8 | 1,060.7 | 1,051.1 | 1,073.1 | 1,005.0 | 1,016.7 | 1,027.0 |
| 1993 | 1,335.5 | 1,381.2 | 1,163.7 | 1,435.7 | 1,466.4 | 1,307.8 | 1,270.4 | 1,254.0 | 1,384.7 | 1,371.1 | 1,390.7 | 1,355.6 |
| 1994 | 1,446.8 | 1,640.5 | 1,409.2 | 1,582.8 | 1,565.9 | 1,467.2 | 1,613.5 | 1,583.1 | 1,768.1 | 1,491.6 | 1,436.9 | 1,443.9 |
| 1995 | 1,395.4 | 1,479.4 | 1,413.8 | 1,565.5 | 1,527.0 | 1,515.5 | 1,442.8 | 1,442.0 | 1,571.1 | 1,492.3 | 1,671.3 | 1,507.9 |
| 1996 | 1,523.7 | 1,640.3 | 1,602.9 | 1,687.2 | 1,668.3 | 1,590.6 | 1,314.8 | 1,246.8 | 1,430.7 | 1,384.9 | 1,317.8 | 1,337.7 |
| 1997 | 1,354.3 | 1,357.4 | 1,305.1 | 1,517.1 | 1,406.6 | 1,425.5 | 1,129.3 | 1,217.6 | 1,081.7 | 1,146.0 | 1,243.9 | 1,169.6 |
| 1998 | 1,152.3 | 1,264.0 | 1,080.0 | 1,215.1 | 1,217.7 | 1,308.3 | 1,116.3 | 1,151.0 | 1,141.2 | 1,403.4 | 1,479.7 | 1,228.4 |
| 1999 | 1,132.3 | 1,154.0 | 1,177.0 | 1,140.0 | 1,313.5 | 945.5 | 888.1 | 851.9 | 806.2 | 849.3 | 749.4 | 840.1 |
| 2000 | 787.5 | 984.3 | 937.6 | 734.2 | 660.8 | 906.0 | 625.5 | 727.2 | 682.5 | 629.4 | 676.9 | 592.5 |
| 2001 | 616.9 | 691.5 | 566.1 | 518.7 | 641.4 | 543.6 | 675.4 | 716.9 | 515.2 | 468.6 | 612.7 | 596.9 |
| 2002 | 583.9 | 533.2 | 596.2 | 614.4 | 550.9 | 504.4 | 869.0 | 770.7 | 632.0 | 788.6 | 714.8 | 654.3 |
| 2003 | 634.4 | 668.4 | 671.4 | 676.2 | 736.8 | 773.9 | 780.7 | 837.4 | 776.3 | 866.2 | 931.0 | 749.6 |
| 2004 | 1,009.6 | 992.6 | 842.0 | 939.1 | 949.5 | 943.1 | 998.5 | 1,048.2 | 1,036.3 | 982.4 | 1,083.8 | 1,152.9 |
| 2005 | 977.7 | 1,065.9 | 938.0 | 1,124.8 | 1,076.8 | 1,166.0 | 763.8 | 775.4 | 783.8 | 571.8 | 496.0 | 535.7 |
| 2006 | 524.1 | 456.5 | 581.7 | 538.3 | 526.3 | 481.4 | 631.5 | 502.0 | 540.1 | 497.2 | 595.6 | 532.3 |
| 2007 | 523.7 | 586.1 | 499.4 | 569.7 | 473.5 | 438.9 | 550.2 | 508.6 | 493.5 | 473.4 | 457.2 | 395.8 |
| 2008 | 375.0 | 328.0 | 391.0 | 505.2 | 440.0 | 436.6 | 332.5 | 345.4 | 325.7 | 338.3 | 317.1 | 276.9 |
| 2009 | 213.0 | 141.6 | 146.3 | 146.1 | 150.8 | 247.2 | 145.6 | 135.9 | 148.5 | 145.5 | 129.9 | 163.5 |
| 2010 | 137.4 | 145.8 | 172.0 | 211.3 | 201.0 | 243.7 | 278.4 | 267.5 | 254.9 | 252.0 | 227.6 | 252.6 |
| 2011 | 230.7 | 227.0 | 259.3 | 229.5 | 236.7 | 201.5 | 413.1 | 220.7 | 288.7 | 262.0 | 206.0 | 193.6 |
| 2012 | 186.1 | 195.4 | 217.9 | 221.2 | 249.7 | 253.7 | 233.2 | 230.2 | 233.6 | 237.6 | 199.0 | W |
| 2013 | 204.5 | 203.2 | 210.0 | NA | NA | W | NA | 148.6 | W | 169.6 | W | W |
| 2014 | W | 141.5 | 126.3 | 171.4 | 141.5 | 147.3 | 192.9 | W | W | W | W | W |
| 2015 | W | W | 243.5 | W | W | W | 149.8 | W | 162.0 | 168.2 | W | 176.7 |
| 2016 | W | 142.1 | 203.0 | 171.7 | 185.1 | W | W | W | W | W | W | W |
| 2017 | W | W | W | W | 296.1 | W | W | W | W | W | W | W |
| 2018 | W | W | W | W | W | W | W | W | W | W | W | W |
| 2019 | W | W | W | W | W | W | W | W | W | W | W | W |
| 2020 | W | W | W | W | W | W | W | W | W | W | W | W |
| 2021 | W | W | W | W | W | W | W | W | W | W | W | W |
| 2022 | W | W | W | |||||||||
| - = No Data Reported; -- = Not Applicable; NA = Not Available; W = Withheld to avoid disclosure of individual company data. |
| Release Date: 6/1/2022 |
| Next Release Date: TBD |