|
Download Data (XLS File) |
|
||||||||
|
||||||||
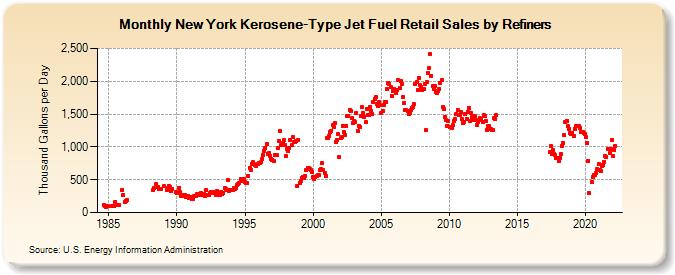
| New York Kerosene-Type Jet Fuel Retail Sales by Refiners (Thousand Gallons per Day) | ||||||||
| Year | Jan | Feb | Mar | Apr | May | Jun | Jul | Aug | Sep | Oct | Nov | Dec |
|---|---|---|---|---|---|---|---|---|---|---|---|---|
| 1984 | 108.7 | 100.1 | 89.3 | 101.7 | ||||||||
| 1985 | W | W | W | 101.1 | 97.1 | 94.1 | 163.3 | W | 115.4 | 113.4 | W | NA |
| 1986 | 344.1 | 269.3 | 158.5 | 178.5 | 189.3 | W | W | W | W | W | W | W |
| 1987 | W | W | W | W | W | W | W | W | W | W | W | W |
| 1988 | W | W | W | 337.6 | 366.4 | W | 429.6 | 384.3 | 354.6 | W | 354.0 | W |
| 1989 | W | 400.1 | W | 340.7 | 373.3 | 405.3 | 392.3 | 326.2 | 365.5 | W | W | 306.2 |
| 1990 | 292.6 | 291.7 | 377.9 | 308.4 | 251.7 | 273.7 | 249.4 | 262.5 | 235.7 | 234.9 | 253.8 | 226.8 |
| 1991 | 234.4 | 201.8 | 199.7 | 244.9 | 252.9 | 248.8 | 277.6 | 282.5 | 267.7 | 303.0 | 278.2 | 273.7 |
| 1992 | 276.0 | 256.4 | 339.6 | 270.2 | 271.4 | 298.7 | 307.5 | 306.6 | 313.3 | 302.2 | 273.7 | 323.7 |
| 1993 | 272.5 | 291.0 | 275.0 | 316.8 | 284.7 | 300.8 | 367.5 | 366.3 | 337.9 | 501.7 | 335.0 | 336.0 |
| 1994 | 341.9 | 340.6 | 372.4 | 357.1 | 367.6 | 413.3 | 434.5 | 455.2 | 511.5 | 496.0 | 483.6 | 507.0 |
| 1995 | 470.2 | 447.1 | 449.6 | 553.7 | 681.0 | 648.0 | 747.0 | 766.0 | 733.7 | 728.2 | 712.1 | 732.9 |
| 1996 | 754.2 | 758.5 | 765.4 | 818.8 | 880.7 | 938.3 | 980.0 | 1,042.3 | 891.9 | 914.1 | 865.0 | 821.7 |
| 1997 | 804.7 | 792.5 | 880.0 | 881.8 | 869.8 | 977.5 | 1,091.9 | 1,240.1 | 1,027.3 | 1,055.8 | 1,098.2 | 1,034.1 |
| 1998 | 858.5 | 975.0 | 932.5 | 989.4 | 1,099.4 | 1,030.0 | 1,145.1 | 1,077.1 | 1,077.1 | 1,087.3 | 408.7 | 1,112.5 |
| 1999 | 455.2 | 477.8 | 530.0 | 539.2 | 532.8 | 560.3 | 644.5 | 676.9 | 678.2 | 662.7 | 649.5 | 622.6 |
| 2000 | 541.6 | 508.9 | 538.4 | 563.9 | 564.5 | 565.1 | 645.8 | 656.4 | 754.6 | 642.1 | 595.4 | 563.6 |
| 2001 | 1,131.6 | 1,137.4 | 1,170.4 | 1,232.3 | 1,244.9 | 1,329.5 | 1,298.4 | 1,363.4 | 1,080.7 | 1,104.8 | 1,195.8 | 843.7 |
| 2002 | 1,131.8 | 1,146.2 | 1,319.4 | 1,223.4 | 1,183.5 | 1,322.4 | 1,473.6 | 1,472.5 | 1,562.7 | 1,543.5 | 1,446.8 | 1,362.9 |
| 2003 | 1,395.3 | 1,381.6 | 1,519.0 | 1,241.7 | 1,325.6 | 1,303.2 | 1,475.6 | 1,603.6 | 1,514.0 | 1,462.8 | 1,374.9 | 1,583.5 |
| 2004 | 1,483.2 | 1,487.6 | 1,609.3 | 1,552.8 | 1,502.5 | 1,686.4 | 1,735.9 | 1,752.4 | 1,646.5 | 1,619.5 | 1,679.6 | 1,631.0 |
| 2005 | 1,515.9 | 1,551.5 | 1,641.4 | 1,688.7 | 1,686.6 | 1,883.0 | 1,976.3 | 1,960.6 | 1,913.0 | 1,775.2 | 1,854.2 | 1,874.3 |
| 2006 | 1,853.7 | 1,821.1 | 1,861.7 | 2,017.8 | 1,895.1 | 1,999.5 | 1,955.2 | 1,762.4 | 1,670.7 | 1,554.8 | 1,560.4 | 1,543.4 |
| 2007 | 1,493.3 | 1,515.1 | 1,555.6 | 1,597.2 | 1,603.7 | 1,647.3 | 1,960.8 | 1,990.9 | 1,868.6 | 2,049.1 | 1,935.1 | 1,917.1 |
| 2008 | 1,860.8 | 1,875.8 | 1,958.7 | 1,249.9 | 1,983.0 | 2,127.0 | 2,199.9 | 2,412.5 | 2,080.3 | 1,921.3 | 1,884.1 | 1,933.6 |
| 2009 | 1,829.5 | 1,819.7 | 1,849.8 | 1,886.2 | 1,972.0 | 2,022.4 | 1,611.9 | 1,579.0 | 1,454.8 | 1,408.1 | 1,324.9 | 1,395.1 |
| 2010 | 1,298.8 | 1,296.8 | 1,284.7 | 1,326.3 | 1,399.8 | 1,421.7 | 1,500.2 | 1,565.1 | 1,489.2 | 1,488.7 | 1,526.1 | 1,418.6 |
| 2011 | 1,364.8 | 1,381.3 | 1,500.0 | 1,432.2 | 1,538.1 | 1,592.9 | 1,390.1 | 1,513.9 | 1,461.0 | 1,406.2 | 1,466.9 | 1,408.3 |
| 2012 | 1,338.3 | 1,374.0 | 1,410.7 | 1,433.7 | 1,429.2 | 1,382.2 | 1,482.7 | 1,465.1 | 1,390.8 | 1,260.5 | 1,313.3 | 1,312.2 |
| 2013 | 1,275.5 | 1,253.3 | 1,257.0 | 1,435.8 | 1,430.6 | 1,480.5 | W | W | W | W | W | W |
| 2014 | W | W | W | W | W | W | W | W | W | W | W | W |
| 2015 | W | W | W | W | W | W | W | W | W | W | W | W |
| 2016 | W | W | W | W | W | W | W | W | W | W | W | W |
| 2017 | W | W | W | W | 922.1 | 1,006.4 | 884.4 | 960.0 | 894.1 | 872.4 | 824.7 | 835.7 |
| 2018 | 787.9 | 828.7 | 886.9 | 1,012.7 | 1,062.6 | 1,177.1 | 1,373.9 | 1,400.1 | 1,311.2 | 1,275.6 | 1,205.9 | 1,203.0 |
| 2019 | 1,212.0 | 1,165.3 | 1,278.1 | 1,311.5 | 1,318.6 | 1,323.3 | 1,314.1 | 1,289.6 | 1,225.5 | 1,232.4 | 1,210.1 | 1,191.8 |
| 2020 | 1,144.5 | 1,065.5 | 791.3 | 298.2 | W | 467.7 | 545.5 | 573.6 | 571.6 | 595.7 | 669.2 | 734.8 |
| 2021 | 641.3 | 628.7 | 703.9 | 727.2 | 776.2 | 857.2 | 848.4 | 972.2 | 967.6 | 904.8 | 961.7 | 1,105.3 |
| 2022 | 860.9 | 954.9 | 1,016.5 | |||||||||
| - = No Data Reported; -- = Not Applicable; NA = Not Available; W = Withheld to avoid disclosure of individual company data. |
| Release Date: 6/1/2022 |
| Next Release Date: TBD |