|
Download Data (XLS File) |
|
||||||||
|
||||||||
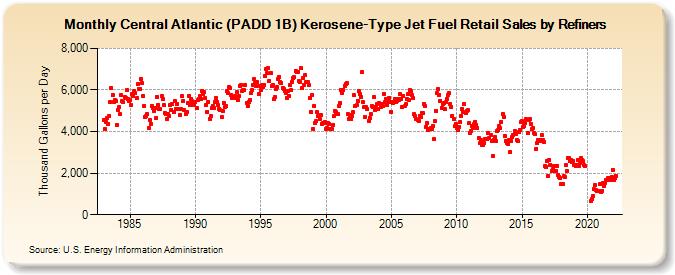
| Central Atlantic (PADD 1B) Kerosene-Type Jet Fuel Retail Sales by Refiners (Thousand Gallons per Day) | ||||||||
| Year | Jan | Feb | Mar | Apr | May | Jun | Jul | Aug | Sep | Oct | Nov | Dec |
|---|---|---|---|---|---|---|---|---|---|---|---|---|
| 1983 | 4,543.5 | 4,100.9 | 4,459.5 | 4,634.2 | 4,380.9 | 4,748.8 | 5,441.9 | 6,102.1 | 5,766.7 | 5,423.0 | 5,499.5 | 5,482.1 |
| 1984 | 4,336.9 | 5,031.2 | 5,157.8 | 4,825.3 | 5,765.2 | 5,449.6 | 5,401.6 | 5,667.9 | 5,613.7 | 5,995.0 | 5,549.9 | 5,454.9 |
| 1985 | 5,521.5 | 5,279.6 | 5,797.3 | 5,706.3 | 5,966.5 | 5,856.6 | 5,594.1 | 6,271.6 | 6,043.3 | 6,048.5 | 6,532.8 | 6,340.7 |
| 1986 | 5,715.7 | 5,242.5 | 4,677.4 | 4,730.9 | 4,833.2 | 4,180.7 | 4,537.0 | 4,375.7 | 5,243.0 | 5,113.8 | 4,998.9 | 5,123.1 |
| 1987 | 4,641.3 | 5,671.1 | 5,288.5 | 5,084.1 | 5,061.2 | 5,696.9 | 5,545.3 | 5,273.8 | 4,914.9 | 4,855.7 | 4,622.6 | 4,857.0 |
| 1988 | 4,749.4 | 5,293.1 | 5,057.7 | 5,330.4 | 4,946.0 | 5,469.2 | 5,083.4 | 5,307.4 | 5,101.2 | 5,086.1 | 4,818.7 | 5,084.0 |
| 1989 | 5,701.5 | 5,474.1 | 5,020.3 | 4,839.5 | 4,940.1 | 5,371.8 | 5,727.8 | 5,261.0 | 5,569.1 | 5,476.6 | 5,389.6 | 5,262.5 |
| 1990 | 5,437.9 | 5,120.8 | 5,499.9 | 5,573.2 | 5,686.2 | 5,569.3 | 5,965.8 | 5,788.8 | 5,900.2 | 5,598.3 | 5,278.3 | 4,961.3 |
| 1991 | 5,412.7 | 4,605.5 | 4,726.0 | 5,152.0 | 5,252.7 | 5,149.1 | 5,412.4 | 5,605.6 | 5,425.9 | 5,266.5 | 5,080.9 | 5,036.5 |
| 1992 | 4,717.5 | 4,964.9 | 5,395.9 | 5,176.6 | 5,233.5 | 5,945.7 | 5,856.3 | 6,140.9 | 6,076.1 | 5,777.4 | 5,607.7 | 5,650.2 |
| 1993 | 5,697.4 | 5,628.1 | 5,892.7 | 5,529.3 | 5,721.6 | 6,213.2 | 6,260.4 | 5,960.6 | 5,990.0 | 5,984.9 | 6,232.6 | 5,376.1 |
| 1994 | 5,252.8 | 5,420.6 | 5,494.3 | 5,841.3 | 5,997.0 | 6,230.1 | 6,511.1 | 6,342.5 | 6,193.3 | 6,370.3 | 5,786.2 | 6,203.2 |
| 1995 | 5,976.0 | 6,217.7 | 6,120.5 | 6,253.8 | 6,695.0 | 7,018.9 | 6,797.9 | 7,052.3 | 6,436.4 | 6,813.7 | 6,188.8 | 6,243.3 |
| 1996 | 5,551.5 | 5,647.1 | 6,046.2 | 6,142.2 | 6,515.4 | 6,627.0 | 6,386.0 | 6,335.2 | 6,099.4 | 6,033.4 | 5,964.2 | 5,854.7 |
| 1997 | 5,625.4 | 5,937.2 | 5,720.4 | 6,227.1 | 6,007.2 | 6,395.8 | 6,574.9 | 6,600.4 | 6,923.0 | 6,842.7 | 6,886.3 | 6,429.1 |
| 1998 | 6,393.1 | 7,037.1 | 6,092.3 | 6,581.2 | 6,262.6 | 6,710.5 | 6,390.1 | 6,387.6 | 6,227.5 | 5,616.9 | 4,952.5 | 5,751.7 |
| 1999 | 4,143.6 | 5,234.3 | 4,398.8 | 4,493.3 | 4,933.7 | 4,756.9 | 4,621.7 | 4,796.8 | 4,378.8 | 4,418.0 | 4,401.7 | 4,446.7 |
| 2000 | 4,144.7 | 4,153.2 | 4,390.6 | 4,380.7 | 4,112.6 | 4,138.5 | 4,307.0 | 4,729.1 | 5,005.4 | 4,936.9 | 4,867.9 | 4,824.0 |
| 2001 | 5,234.5 | 5,368.6 | 5,995.4 | 5,832.2 | 6,017.2 | 6,206.7 | 6,284.7 | 6,322.4 | 4,840.8 | 4,588.1 | 4,780.4 | 4,582.1 |
| 2002 | 4,771.6 | 4,927.0 | 5,742.8 | 5,221.6 | 5,256.5 | 5,483.2 | 5,937.3 | 5,794.6 | 5,676.3 | 6,862.7 | 5,413.1 | 5,197.0 |
| 2003 | 4,702.4 | 5,165.7 | 5,081.8 | 4,513.3 | 4,673.1 | 4,822.4 | 5,225.1 | 5,193.1 | 5,675.1 | 5,040.2 | 5,162.6 | 5,327.5 |
| 2004 | 5,069.8 | 5,353.1 | 5,198.2 | 5,327.2 | 5,212.4 | 5,825.3 | 5,398.1 | 5,581.2 | 5,300.7 | 5,431.8 | 5,632.4 | 5,441.7 |
| 2005 | 4,963.4 | 5,383.6 | 5,435.0 | 5,571.0 | 5,442.1 | 5,488.3 | 5,574.5 | 5,508.4 | 5,795.1 | 5,574.2 | 5,201.4 | 5,705.9 |
| 2006 | 5,209.3 | 5,310.4 | 5,571.9 | 5,792.7 | 5,523.2 | 5,984.7 | 5,929.1 | 5,757.1 | 5,596.5 | 4,843.5 | 4,728.1 | 4,580.5 |
| 2007 | 4,535.3 | 4,524.4 | 4,770.7 | 4,714.0 | 4,901.3 | 4,877.3 | 5,330.7 | 5,207.5 | 4,235.5 | 4,418.7 | 4,052.1 | 4,140.8 |
| 2008 | 4,160.7 | 4,145.6 | 4,273.8 | 3,629.9 | 4,486.2 | 5,004.6 | 5,860.0 | 6,032.0 | 5,761.0 | 5,486.9 | 5,148.5 | 5,310.4 |
| 2009 | 5,372.9 | 5,061.5 | 5,409.3 | 5,584.2 | 5,767.5 | 5,840.1 | 5,335.4 | 5,192.9 | 4,767.1 | 4,581.6 | 4,246.5 | 4,362.8 |
| 2010 | 4,178.2 | 4,064.6 | 4,239.5 | 4,460.3 | 4,760.4 | 5,101.3 | 4,919.0 | 5,302.4 | 4,887.9 | 4,995.0 | 5,012.6 | 4,399.7 |
| 2011 | 3,946.3 | 4,020.9 | 4,283.5 | 4,184.9 | 4,358.0 | 4,480.5 | 4,312.2 | 4,161.1 | 3,690.8 | 3,447.9 | 3,572.0 | 3,349.6 |
| 2012 | 3,375.2 | 3,446.5 | 3,652.2 | 3,634.6 | 3,623.6 | 3,932.3 | 3,668.0 | 3,813.0 | 3,531.3 | 2,842.7 | 3,607.2 | 3,716.3 |
| 2013 | 3,545.1 | 4,033.3 | 4,067.1 | 4,254.7 | 4,171.6 | 4,469.2 | 4,834.6 | 4,713.8 | 3,787.7 | 3,562.3 | 3,444.3 | 3,424.5 |
| 2014 | 3,577.5 | 3,022.0 | 3,545.8 | 3,724.9 | 3,836.0 | 4,021.0 | 3,858.5 | 3,615.6 | 3,540.9 | 3,955.4 | 4,089.2 | 4,444.7 |
| 2015 | 4,498.9 | 4,222.9 | 4,266.5 | 4,414.8 | 4,601.6 | 3,948.0 | 4,566.5 | 4,599.5 | 4,379.6 | 4,132.3 | 4,165.5 | 3,921.0 |
| 2016 | 3,858.4 | 3,173.7 | 3,440.5 | 3,605.2 | 3,537.0 | 3,599.9 | 3,819.1 | 3,591.3 | 3,503.9 | 2,337.4 | 2,298.1 | 2,607.5 |
| 2017 | 1,885.1 | 2,629.4 | 2,409.7 | 2,104.0 | 2,188.4 | 2,365.0 | 2,086.3 | 2,119.7 | 2,362.4 | 1,890.8 | 1,824.7 | 1,745.1 |
| 2018 | 1,478.8 | 1,499.7 | 1,844.0 | 1,825.1 | 2,375.4 | 2,125.4 | 2,733.1 | 2,732.1 | 2,603.0 | 2,653.4 | 2,513.8 | 2,571.8 |
| 2019 | 2,391.5 | 2,349.7 | 2,393.5 | 2,639.2 | 2,364.8 | 2,475.5 | 2,716.9 | 2,635.1 | 2,570.7 | 2,368.1 | 2,349.2 | W |
| 2020 | W | W | W | 658.4 | 779.6 | 920.4 | 1,234.8 | 1,414.2 | 1,165.6 | 1,117.6 | 1,141.3 | 1,464.2 |
| 2021 | 1,112.8 | 1,162.9 | 1,509.4 | 1,381.1 | 1,531.9 | 1,684.0 | 1,673.9 | 1,741.9 | 1,748.4 | 1,657.5 | 1,824.9 | 2,167.0 |
| 2022 | 1,680.3 | 1,744.5 | 1,878.2 | |||||||||
| - = No Data Reported; -- = Not Applicable; NA = Not Available; W = Withheld to avoid disclosure of individual company data. |
| Release Date: 6/1/2022 |
| Next Release Date: TBD |